Rocky River: Fire Incidents, Ohio (OH)
Where are fire incidents reported in Rocky River, OH
Something went wrong! Please refresh the page.
| Fire incidents reported | |
|---|---|
| Sreet name | Count |
| CENTER RIDGE RD | 266 |
| LAKE RD | 134 |
| DETROIT RD | 124 |
| HILLIARD BLVD | 96 |
| WOOSTER RD | 50 |
| PEASE DR | 34 |
| RIVER OAKS DR | 30 |
| MOREWOOD PKY | 28 |
| LINDA ST | 24 |
| AVALON DR | 22 |
| ELMWOOD RD | 22 |
| RIVERVIEW AVE | 22 |
| WOOSTER | 22 |
| FRAZIER DR | 18 |
| LINDEN RD | 18 |
| LAKE | 14 |
| LINDA | 14 |
| BEACHCLIFF BLVD | 12 |
| HAMPTON RD | 12 |
| I-90 WESTBOUND HWY | 12 |
| LAKEVIEW AVE | 12 |
| MOREWOOD | 12 |
| PURNELL AVE | 12 |
| DELMAR DR | 10 |
| HILLIARD | 10 |
| I-90 | 10 |
| I-90 EASTBOUND HWY | 10 |
| NORTHVIEW AVE | 10 |
| PEASE | 10 |
| RIVERVIEW | 10 |
2002 - 2018 National Fire Incident Reporting System (NFIRS) incidents
- Incident types reported to NFIRS in Rocky River, OH
- 9,81966.2%Rescue & EMS
- 1,1277.6%Hazardous Condition
- 1,0166.9%Service Call
- 9696.5%False Alarm
- 9246.2%Good Intent Call
- 9046.1%Fire
- 460.3%Overpressure Rupture
- Fire incident types reported to NFIRS in Rocky River, OH
- 58464.6%Structure Fires
- 22524.9%Outside Fires
- 849.3%Mobile Property/Vehicle Fires
- 111.2%Other
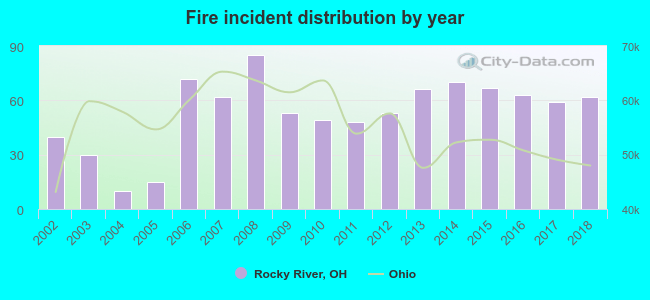 According to the data from the years 2002 - 2018 the average number of fire incidents per year is 53. The highest number of reported fire incidents - 85 took place in 2008, and the least - 10 in 2004. The data has an increasing trend.
The average number of yearly fire incidents per 10k residents in Rocky River, OH compared to nearest cities:
(Note: Based on data for the last 3 years, including only cities with population 5,000 and above)
| Rocky River: | 30.0 |
| Lakewood: | 27.4 |
| Fairview Park: | 33.2 |
| Bay Village: | 21.8 |
| Westlake: | 30.5 |
| Brook Park: | 25.1 |
| North Olmsted: | 39.7 |
| Brooklyn: | 42.3 |
| Berea: | 43.9 |
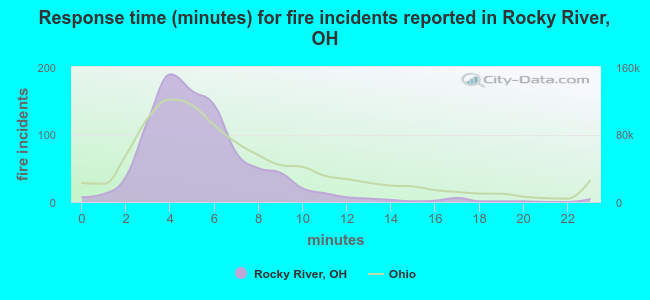 The median response time based on all reported fire incidents is 5 minutes. This is lower compared to the state median value.
The median response time in Rocky River, OH compared to nearest cities:
(Note: Based on data for all years, including only cities with at least 500 fire incidents)
| Rocky River: | 5 minutes |
| Lakewood: | 4 minutes |
| Fairview Park: | 5 minutes |
| Bay Village: | 5 minutes |
| Westlake: | 6 minutes |
| Brook Park: | 5 minutes |
| North Olmsted: | 4 minutes |
| Brooklyn: | 4 minutes |
| Berea: | 5 minutes |
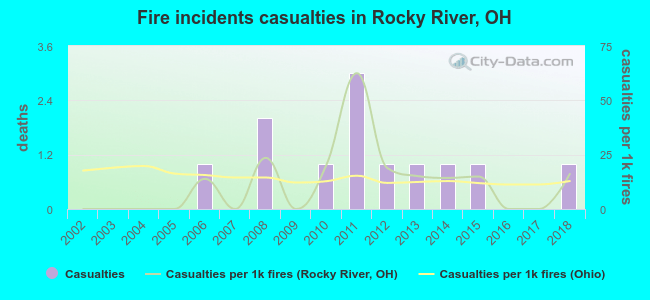 According to the reports from the years 2002 - 2018 the average number of fire-related yearly casualties is 1. The highest number of reported casualties - 3 took place in 2011, and the lowest - 0 in 2002. The data has an increasing trend.
The average number of injuries per 1,000 fire incidents is 12. This indicator was the highest - 63 in 2011, and the lowest 0 in 2002. The trend for casualties per 1,000 fire incidents is increasing. Compared to the Ohio value the number of injuries per 1,000 fires is about the same.
According to the reports from the years 2002 - 2018 the average number of fire-related yearly casualties is 1. The highest number of reported casualties - 3 took place in 2011, and the lowest - 0 in 2002. The data has an increasing trend.
The average number of injuries per 1,000 fire incidents is 12. This indicator was the highest - 63 in 2011, and the lowest 0 in 2002. The trend for casualties per 1,000 fire incidents is increasing. Compared to the Ohio value the number of injuries per 1,000 fires is about the same.Casualties per 1,000 incidents in Rocky River, OH compared to nearest cities:
(Note: Based on data for all years, including only cities with at least 500 fire incidents)
| Rocky River: | 13.3 |
| Lakewood: | 33.3 |
| Fairview Park: | 7.1 |
| Bay Village: | 9.0 |
| Westlake: | 27.5 |
| Brook Park: | 25.0 |
| North Olmsted: | 10.2 |
| Brooklyn: | 6.3 |
| Berea: | 15.4 |
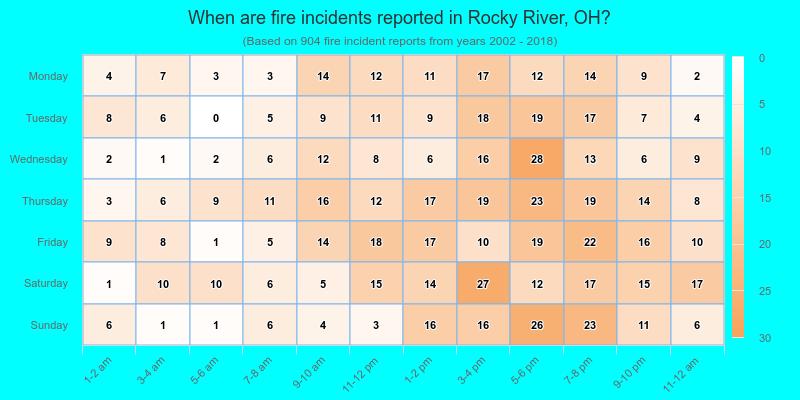
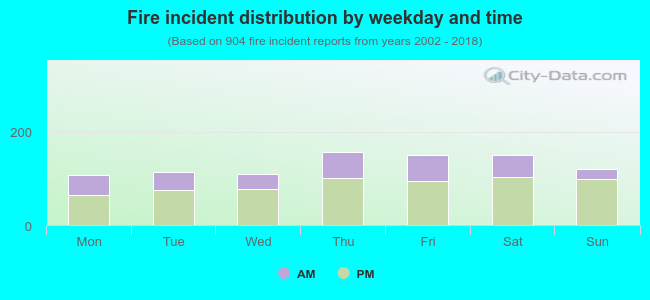 32.4% incidents where reported in the morning and 67.6% in the evening. The most fires (17.4%) took place on Thursday, and the least (11.9%) on Monday.
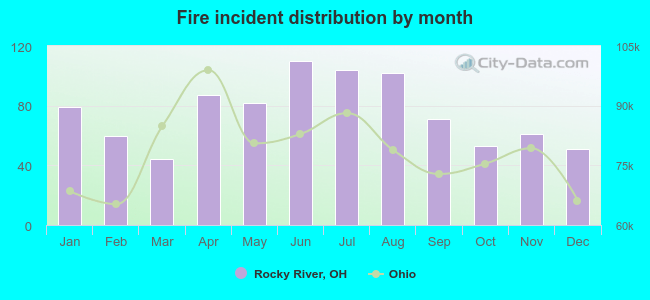 According to the 904 fire incident reports from years 2002 - 2018 most fires (12.2%) took place during June, and the least (4.9%) in March.
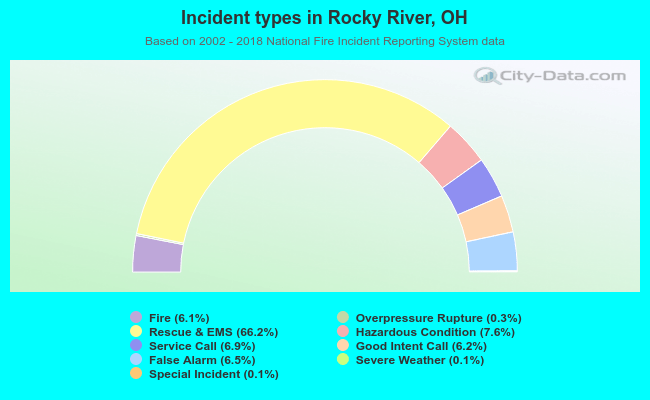 Out of all 14,827 cases reported during the years 2002 - 2018, the most belonged to the categories: Rescue & EMS (66.2%), Hazardous Condition (7.6%), and Service Call (6.9%).
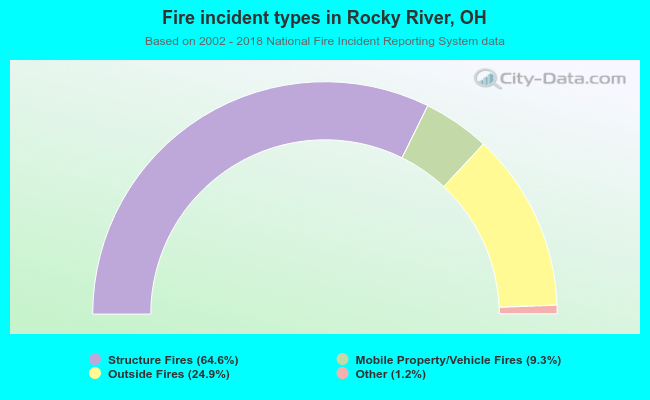 When looking into fire subcategories, the most incidents belonged to: Structure Fires (64.6%), and Outside Fires (24.9%).