Rogue River: Fire Incidents, Oregon (OR)
Where are fire incidents reported in Rogue River, OR
Something went wrong! Please refresh the page.
|
| |||||||||||||||||||||||||||||||||||||||||||||||||||||||||||||||||||||||||||||||||||||||||||||||||||||||||||||
2002 - 2018 National Fire Incident Reporting System (NFIRS) incidents
- Incident types reported to NFIRS in Rogue River, OR
- 1,59653.2%Rescue & EMS
- 44214.7%Fire
- 41413.8%Good Intent Call
- 35912.0%Service Call
- 1515.0%Hazardous Condition
- 311.0%False Alarm
- 50.2%Severe Weather
- Fire incident types reported to NFIRS in Rogue River, OR
- 20446.2%Outside Fires
- 15635.3%Structure Fires
- 6314.3%Mobile Property/Vehicle Fires
- 194.3%Other
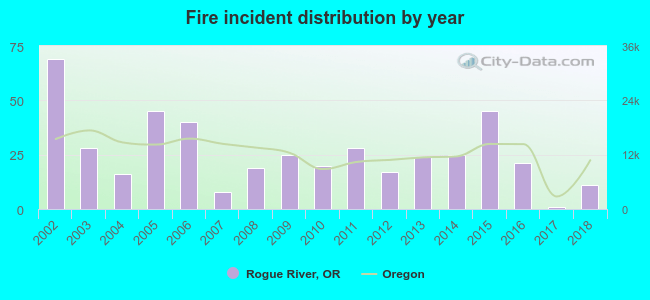 Based on the data from the years 2002 - 2018 the average number of fire incidents per year is 26. The highest number of reported fire incidents - 69 took place in 2002, and the least - 1 in 2017. The data has a decreasing trend.
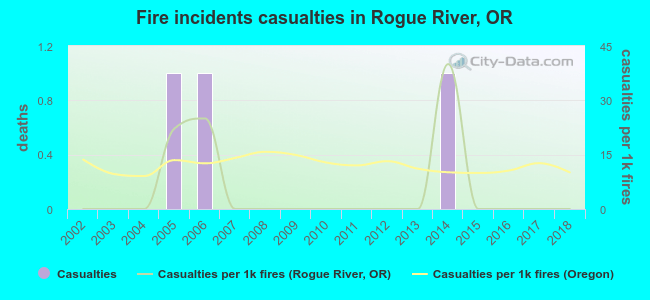 Based on the data from the years 2002 - 2018 the average number of fire-related casualties per year is 0. The highest number of casualties - 1 took place in 2005, and the lowest - 0 in 2002. The data has a constant trend.
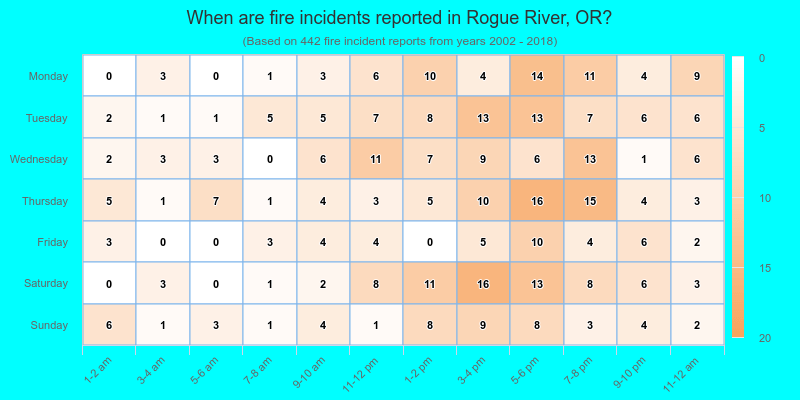
 28.1% incidents where reported in the morning and 71.9% in the evening. The most fires (16.7%) took place on Tuesday, and the least (9.3%) on Friday.
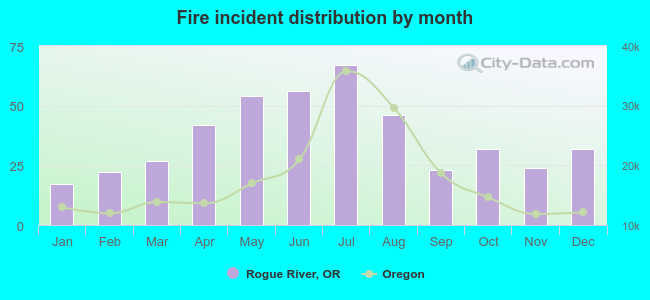 Based on the 442 fire incidents from years 2002 - 2018 most fires (15.2%) took place during July, and the least (3.8%) in January.
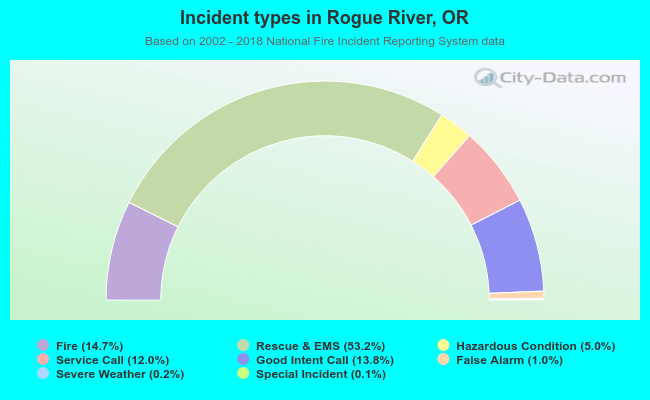 Out of all 3,000 cases reported during the years 2002 - 2018, the most belonged to the categories: Overpressure Rupture (53.2%), Fire (14.7%), and Service Call (13.8%).
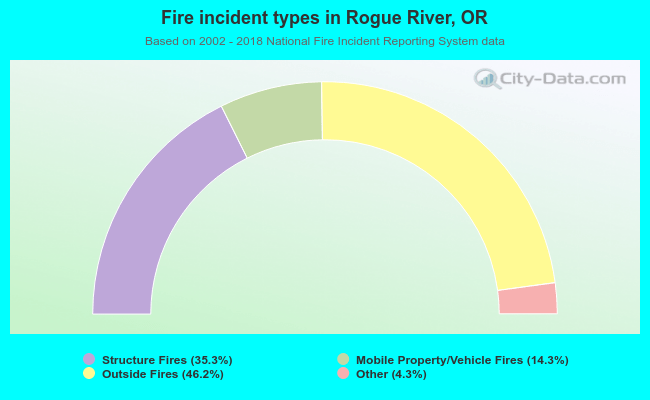 When looking into fire subcategories, the most reports belonged to: Outside Fires (46.2%), and Structure Fires (35.3%).