Sanibel: Fire Incidents, Florida (FL)
Where are fire incidents reported in Sanibel, FL
Something went wrong! Please refresh the page.
|
| |||||||||||||||||||||||||||||||||||||||||||||||||||||||||||||||||||||||||||||||||||||||||||||||||||||||||||||
2003 - 2018 National Fire Incident Reporting System (NFIRS) incidents
- Incident types reported to NFIRS in Sanibel, FL
- 2,69747.4%Rescue & EMS
- 1,05018.5%Good Intent Call
- 5609.9%Service Call
- 5149.0%False Alarm
- 4427.8%Hazardous Condition
- 4127.2%Fire
- Fire incident types reported to NFIRS in Sanibel, FL
- 19848.1%Outside Fires
- 12129.4%Structure Fires
- 5814.1%Mobile Property/Vehicle Fires
- 358.5%Other
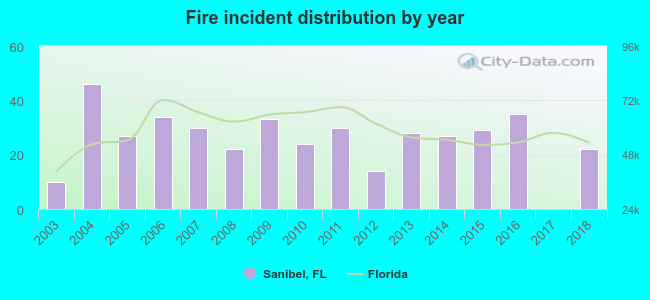 Based on the data from the years 2003 - 2018 the average number of fires per year is 26. The highest number of fires - 46 took place in 2004, and the least - 0 in 2017. The data has a rising trend.
The average number of yearly fire incidents per 10k residents in Sanibel, FL compared to nearest cities:
(Note: Based on data for the last 3 years, including only cities with population 5,000 and above)
| Sanibel: | 40.4 |
| Sanibel Island: | 3.5 |
| Fort Myers Beach: | 6.9 |
| Cape Coral: | 14.4 |
| San Carlos Park: | 0.6 |
| Estero: | 26.8 |
| Bonita Springs: | 27.4 |
| Fort Myers: | 97.1 |
| North Fort Myers: | 59.6 |
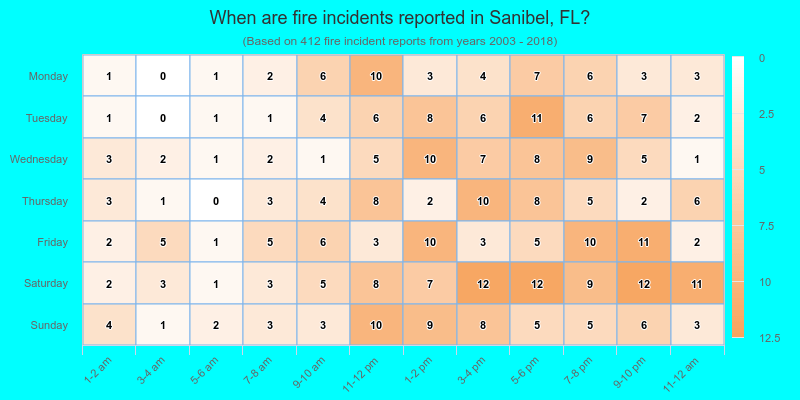
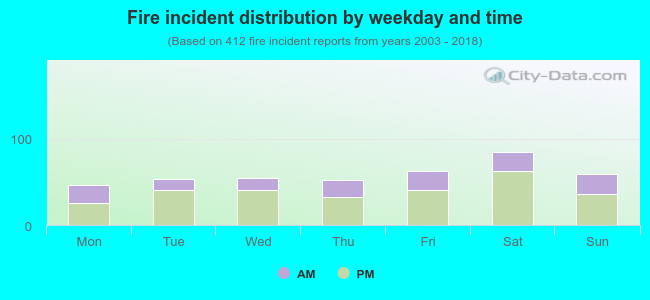 32.3% incidents where reported in the morning and 67.7% in the evening. The most fires (20.6%) took place on Saturday, and the least (11.2%) on Monday.
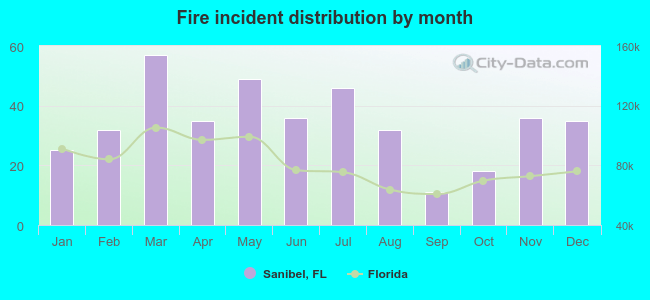 According to the 412 fire incident reports from years 2003 - 2018 most fires (13.8%) took place during March, and the least (2.7%) in September.
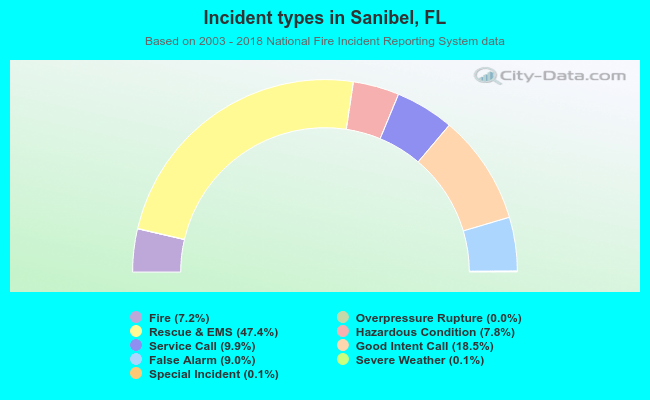 Out of all 5,684 cases reported during the years 2003 - 2018, the most belonged to the categories: Rescue & EMS (47.4%), Good Intent Call (18.5%), and Service Call (9.9%).
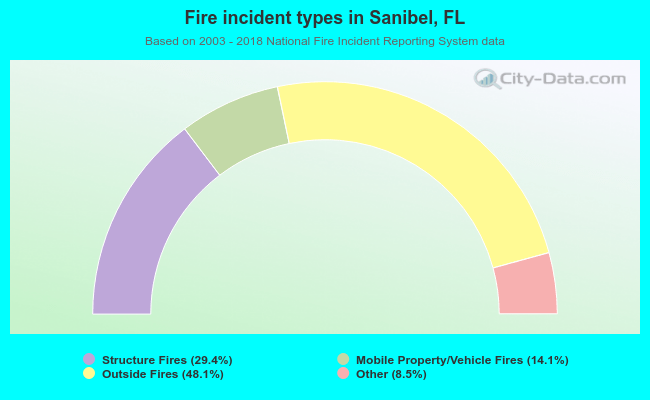 When looking into fire subcategories, the most reports belonged to: Outside Fires (48.1%), and Structure Fires (29.4%).