Satsuma: Fire Incidents, Alabama (AL)
Where are fire incidents reported in Satsuma, AL
Something went wrong! Please refresh the page.
|
| |||||||||||||||||||||||||||||||||||||||||||||||||||||||||||||||||||||||||||||||||||||||||||||||||||||||||||||
2002 - 2018 National Fire Incident Reporting System (NFIRS) incidents
- Incident types reported to NFIRS in Satsuma, AL
- 2,31965.8%Rescue & EMS
- 60417.1%Fire
- 1744.9%Hazardous Condition
- 1524.3%Service Call
- 1524.3%Good Intent Call
- 1163.3%False Alarm
- Fire incident types reported to NFIRS in Satsuma, AL
- 34156.5%Outside Fires
- 16327.0%Structure Fires
- 7712.7%Mobile Property/Vehicle Fires
- 233.8%Other
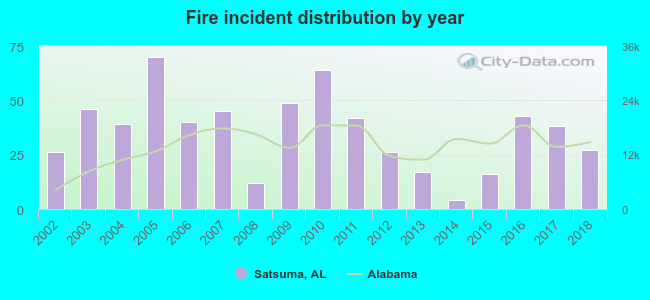 Based on the data from the years 2002 - 2018 the average number of fires per year is 36. The highest number of fires - 70 took place in 2005, and the least - 4 in 2014. The data has a rising trend.
The average number of yearly fire incidents per 10k residents in Satsuma, AL compared to nearest cities:
(Note: Based on data for the last 3 years, including only cities with population 5,000 and above)
| Satsuma: | 58.4 |
| Saraland: | 41.2 |
| Chickasaw: | 1.7 |
| Prichard: | 37.1 |
| Mobile: | 15.4 |
| Spanish Fort: | 34.2 |
| Semmes: | 45.4 |
| Bay Minette: | 70.7 |
| Daphne: | 35.3 |
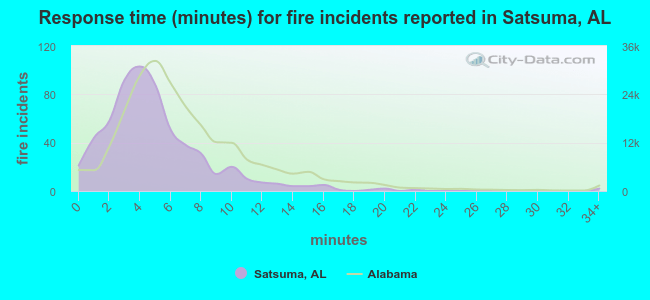 The median response time based on all reported fire incidents is 4 minutes. This is lower than the Alabama median value.
The median response time in Satsuma, AL compared to nearest cities:
(Note: Based on data for all years, including only cities with at least 500 fire incidents)
| Satsuma: | 4 minutes |
| Saraland: | 5 minutes |
| Prichard: | 5 minutes |
| Mobile: | 7 minutes |
| Semmes: | 8 minutes |
| Bay Minette: | 5 minutes |
| Daphne: | 6 minutes |
| Theodore: | 7 minutes |
| Fairhope: | 8 minutes |
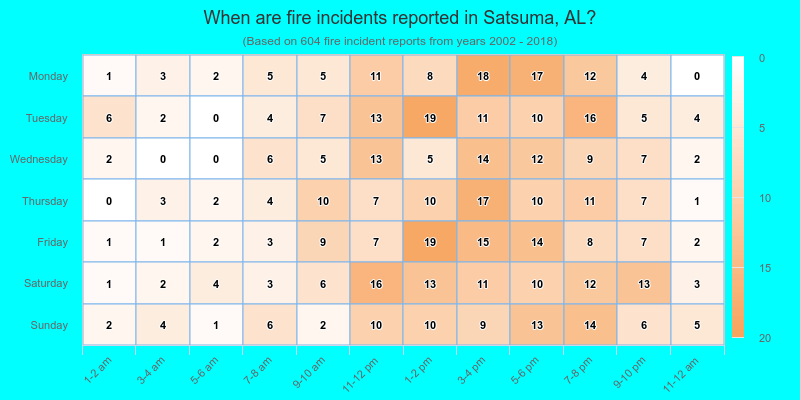
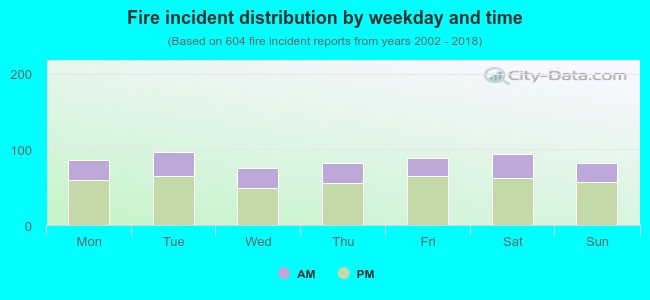 31.6% incidents where reported in the morning and 68.4% in the evening. The most fires (16.1%) took place on Tuesday, and the least (12.4%) on Wednesday.
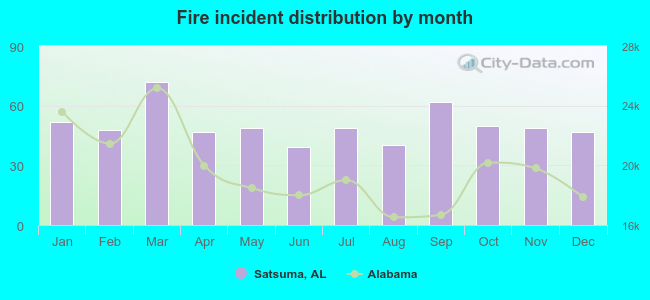 Based on the 604 fires from years 2002 - 2018 most fires (11.9%) took place during March, and the least (6.5%) in June.
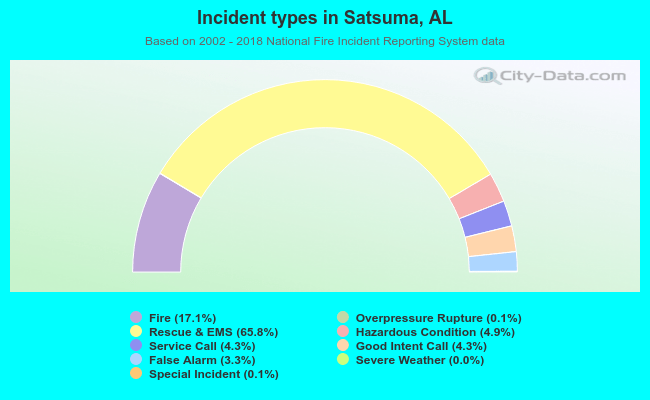 Out of all 3,522 cases reported during the years 2002 - 2018, the most belonged to the categories: Rescue & EMS (65.8%), Fire (17.1%), and Hazardous Condition (4.9%).
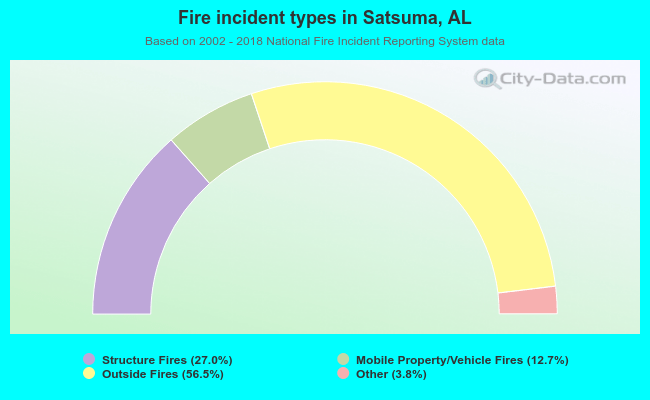 When looking into fire subcategories, the most reports belonged to: Outside Fires (56.5%), and Structure Fires (27.0%).