| Fire incidents reported |
|---|
| Sreet name | Count |
|---|
| ROUTE 32 | 34 | | RT 9W | 34 | | GLENERIE BLVD | 30 | | KINGS HIGHWAY | 18 | | RT 32 | 16 | | GLASCO TURNPIKE | 14 | | GLENERIE BLVD | 14 | | ROUTE 212 | 14 | | OLD STAGE RD | 12 | | ROUTE 32A | 12 | | VILLAGE DR | 12 | | KINGS HWY | 10 | | ROUTE 9W | 10 | | STATE RT 32 | 10 | | DAVE ELLIOT RD | 8 | | MANORVILLE RD | 8 | | BAND CAMP RD | 6 | | CHARLES HOMMEL RD | 6 | | CHURCHLAND ROAD | 6 | | FISH CREEK RD | 6 | | HAUNS HILL RD | 6 | | HIGH FALLS RD | 6 | | JUNIPER LN | 6 | | NYS THRUWAY | 6 | | OLD KINGS HWY | 6 |
| | | Fire incidents reported |
|---|
| Sreet name | Count |
|---|
| RED MAPLE RD | 6 | | STOLL RD | 6 | | VALK RD | 6 | | WASHINGTON AVE | 6 | | WEST SAUGERTIES RD | 6 | | WILDWOOD LN | 6 | | ARTHUR LN | 4 | | ECHO HILL RD | 4 | | EDGEWOOD DR | 4 | | FAWN RD | 4 | | FLATBUSH CAMP ROAD | 4 | | GARDEN CT | 4 | | GEORGE SAILE RD | 4 | | GLASCO TPKE | 4 | | HOUTMAN RD | 4 | | KINGS HIGHWAY ST | 4 | | KINGS HWY | 4 | | NEW YORK STATE THRUWAY | 4 | | NORTH DR | 4 | | NYS THRUWAY HWY | 4 | | OLD ECHO HILL ROAD | 4 | | OLD STAGE ROAD | 4 | | PINE LN | 4 | | POTTER HILL RD | 4 | | SAUGERTIES RD | 4 |
|
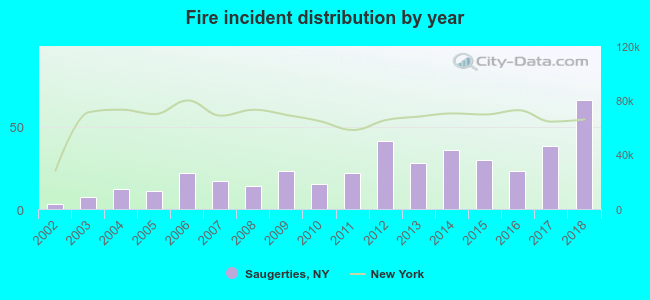 Based on the data from the years 2002 - 2018 the average number of fires per year is 24. The highest number of fire incidents - 66 took place in 2018, and the least - 3 in 2002. The data has a rising trend.
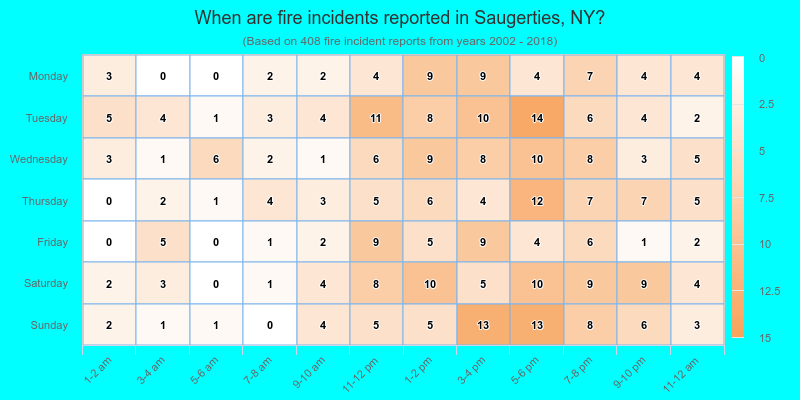
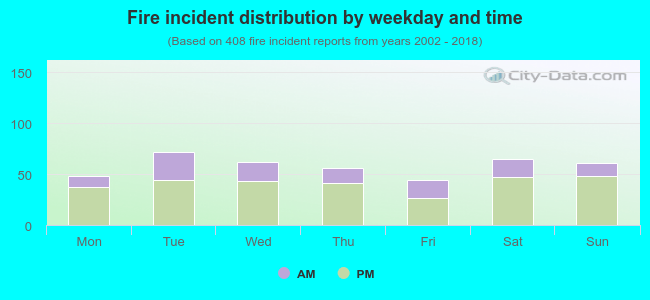 29.7% incidents where reported in the morning and 70.3% in the evening. The most fires (17.6%) took place on Tuesday, and the least (10.8%) on Friday.
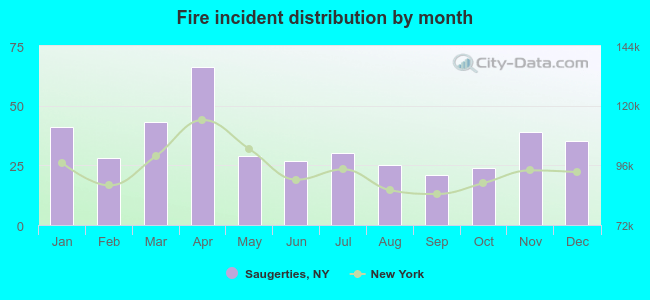 According to the 408 incident reports from years 2002 - 2018 most fires (16.2%) took place during April, and the least (5.1%) in September.
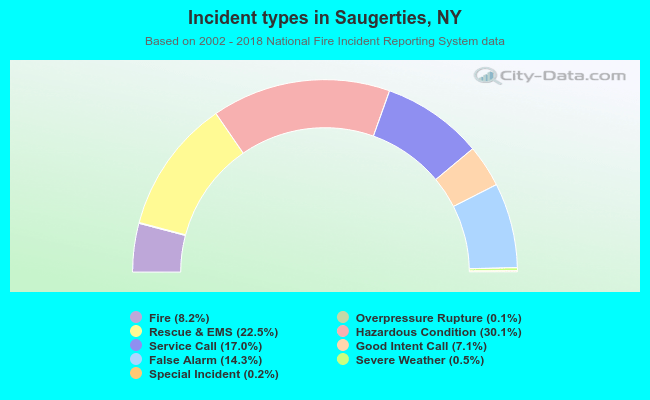 Out of all 5,000 cases reported during the years 2002 - 2018, the most belonged to the categories: Hazardous Condition (30.1%), Rescue & EMS (22.5%), and Service Call (17.0%).
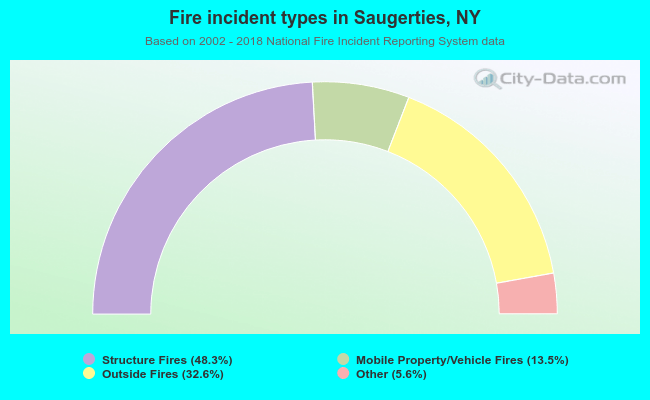 When looking into fire subcategories, the most incidents belonged to: Structure Fires (48.3%), and Outside Fires (32.6%).