| Fire incidents reported |
|---|
| Sreet name | Count |
|---|
| UNIONVILLE RD | 22 | | BAY ST | 12 | | LANGE RD | 12 | | SEBEWAING RD | 12 | | BACH RD | 10 | | GETTEL RD | 10 | | MAIN ST | 10 | | ROSE ISLAND RD | 10 | | GROVE ST | 8 | | BAY PORT RD | 6 | | BECK ST | 6 | | CARO RD | 6 | | CENTER ST | 6 | | GREMEL RD | 6 | | LANG RD | 6 | | MASON ST | 6 | | PINE ST | 6 | | PINE ST | 6 | | 3781 VOLZ RD | 4 | | BEECH DR | 4 | | CANBORO RD | 4 | | FOURTH ST | 4 | | FREDERICK ST | 4 | | HENRY ST | 4 | | HURON LINE RD | 4 |
| | | Fire incidents reported |
|---|
| Sreet name | Count |
|---|
| KILMANAGH RD | 4 | | MILLER RD | 4 | | OUTER DR | 4 | | RINGLE RD | 4 | | SEBEWAING ST | 4 | | SHARPSTEEN ST | 4 | | SIXTH ST | 4 | | VOLZ RD | 4 | | 11120 W HURON LINE RD | 2 | | 1859 OUTER DR. | 2 | | 1867 OUTER DRIVE | 2 | | 1869 OUTER DRIVE | 2 | | 3300 S BAY PORT RD | 2 | | 3645 LANGE RD | 2 | | 4010 LANGE RD | 2 | | 4554 S BAY PORT RD. | 2 | | 4697 GETTEL RD | 2 | | 487 TENTH ST | 2 | | 535 EAST SEBEWAING STREET | 2 | | 536 N CENTER | 2 | | 551 UNION ST ST | 2 | | 555 N. UNION ST | 2 | | 555 UNION ST. | 2 | | 8355 S. UNIONVILLE RD. | 2 | | 8549 STEIN ROAD | 2 |
|
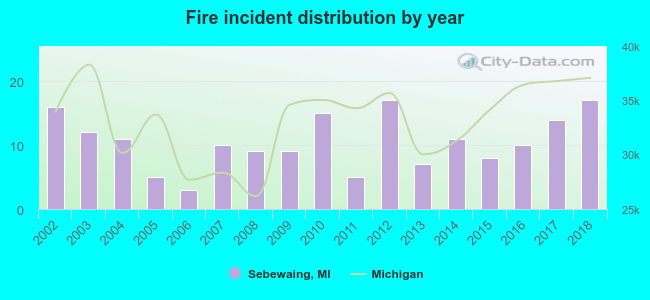 According to the data from the years 2002 - 2018 the average number of fire incidents per year is 11. The highest number of fires - 17 took place in 2012, and the least - 3 in 2006. The data has a growing trend.
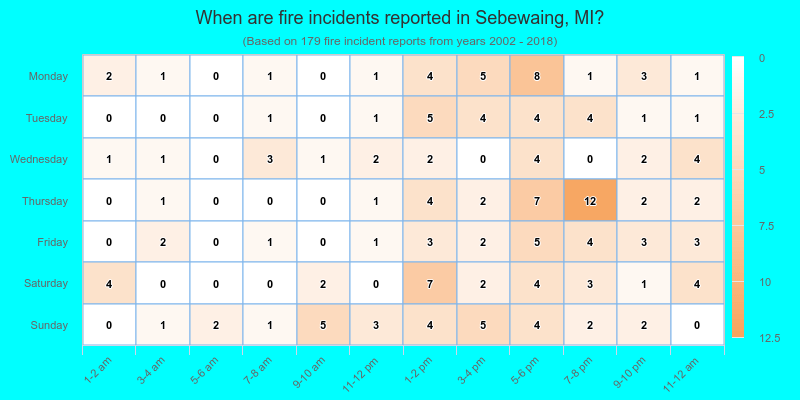
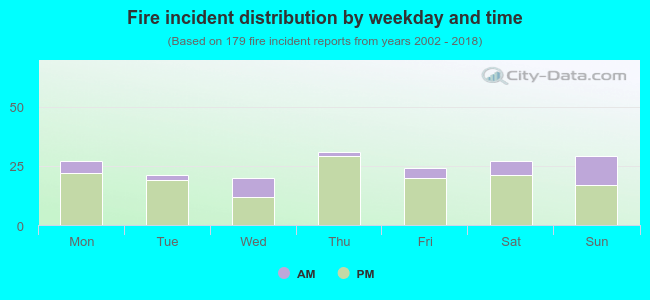 21.8% incidents where reported in the morning and 78.2% in the evening. The most fires (17.3%) took place on Thursday, and the least (11.2%) on Wednesday.
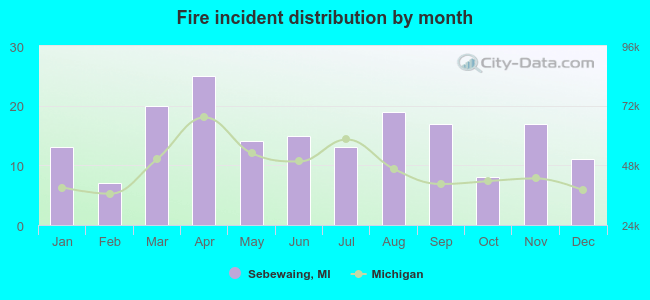 Based on the 179 fire incidents from years 2002 - 2018 most fires (14.0%) took place during April, and the least (3.9%) in February.
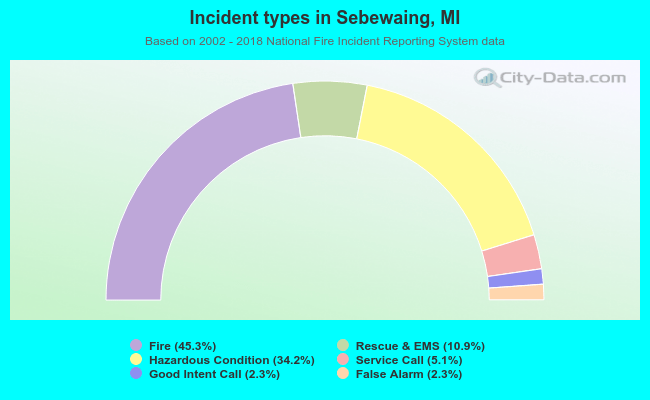 Out of all 395 cases reported during the years 2002 - 2018, the most belonged to the categories: Fire (45.3%), Rescue & EMS (34.2%), and Overpressure Rupture (10.9%).
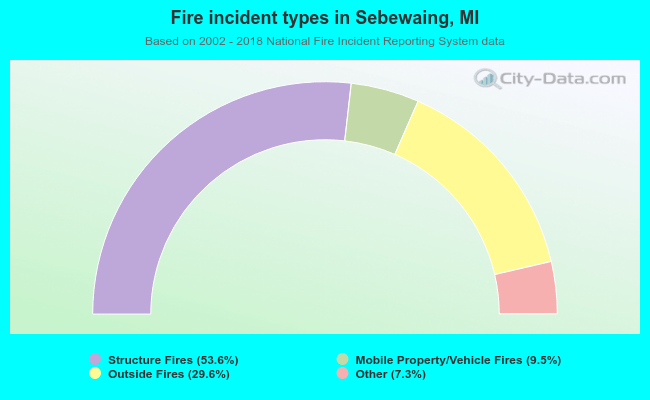 When looking into fire subcategories, the most reports belonged to: Structure Fires (53.6%), and Outside Fires (29.6%).