| Fire incidents reported |
|---|
| Sreet name | Count |
|---|
| SR 56 | 18 | | US 41 | 18 | | SR 370 | 14 | | SR 494 | 12 | | SASSAFRAS GROVE RD | 10 | | SEBREE SLAUGHTERS RD | 10 | | STATE RT 370 | 10 | | DONAHOO RD | 8 | | GRAVEL PIT RD | 8 | | PENNYRILE PKY | 8 | | SR 132 | 8 | | WATKINS SCHOOL RD | 8 | | DIXON ST | 6 | | HWY 56 E | 6 | | STATE RT 132 | 6 | | STATE RT 132 RT | 6 | | STATE RT 56 | 6 | | TROY DR | 6 | | US HWY 41 HWY | 6 | | BREATHITT PKY | 4 | | COLLINS RD | 4 | | COUNTRYSIDE DR | 4 | | GISH RD | 4 | | HENDERSON ST | 4 | | HWY 132 | 4 |
| | | Fire incidents reported |
|---|
| Sreet name | Count |
|---|
| HWY 41 | 4 | | SASSAFRAS GROVE RD | 4 | | ST RT 370 | 4 | | STARL SHELTON RD | 4 | | STATE ROUTE 370 | 4 | | STATE RT 370 RT | 4 | | STATE RT. 370 | 4 | | 10025 ST RT 132 E | 2 | | 10029 STATE RT 132 RT | 2 | | 1012 SASSAFRAS GROVE RD | 2 | | 1051 56 EAST | 2 | | 1113 SEBREE PRETT RD | 2 | | 112 ST RT 370 | 2 | | 1180 STATE RT 370 RT | 2 | | 1220 WATKINS SEBREE ROAD | 2 | | 12230 ST. RT 132 | 2 | | 12230 ST. RT. 132 | 2 | | 1250 STATE ROUTE 370 | 2 | | 1307 OLD SEBREE SLAUGHERS RD | 2 | | 142 ROGER POWELL RD | 2 | | 153 WRIGHTSBURGH ROAD | 2 | | 1541 US 41 | 2 | | 158 SHERRI LANE | 2 | | 164 CATTINGHAM PRATT RD SOUTH | 2 | | |
|
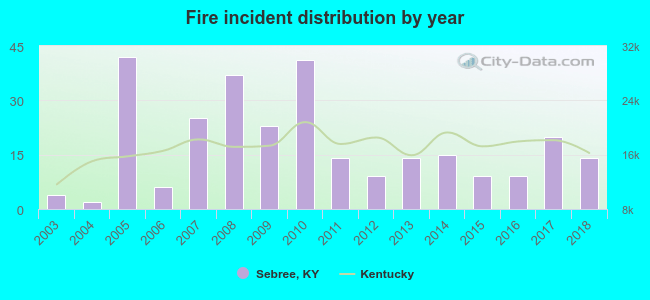 Based on the data from the years 2003 - 2018 the average number of fires per year is 18. The highest number of fires - 42 took place in 2005, and the least - 2 in 2004. The data has a rising trend.
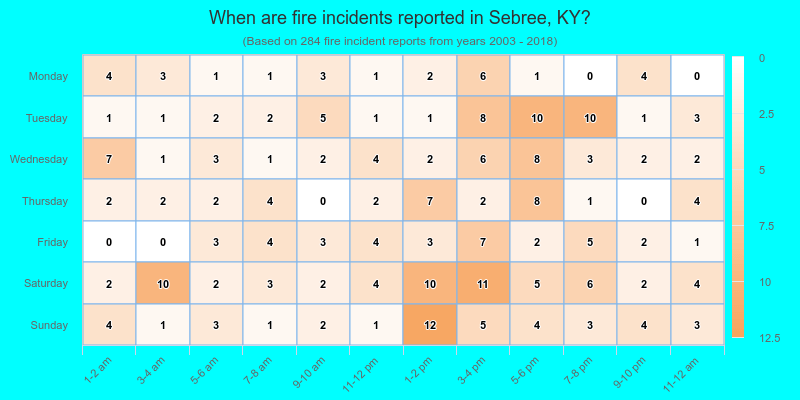
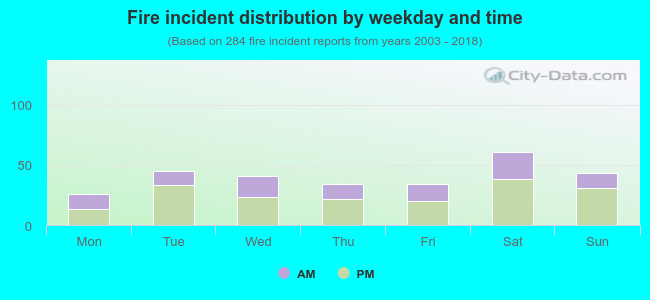 36.6% incidents where reported in the morning and 63.4% in the evening. The most fires (21.5%) took place on Saturday, and the least (9.2%) on Monday.
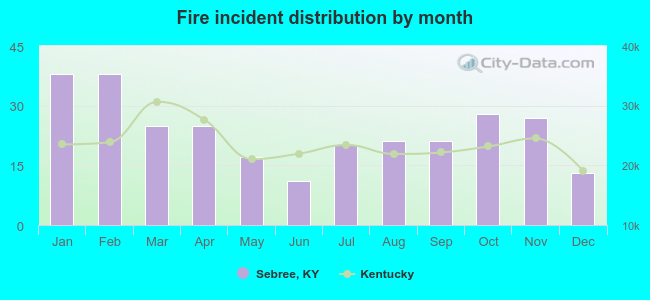 According to the 284 incident reports from years 2003 - 2018 most fires (13.4%) took place during January, and the least (3.9%) in June.
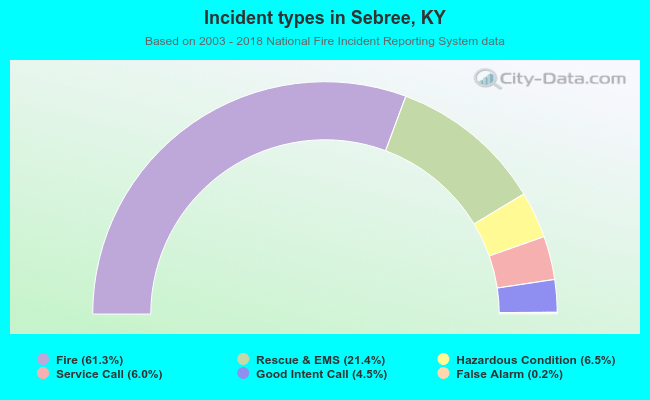 Out of all 463 cases reported during the years 2003 - 2018, the most belonged to the categories: Fire (61.3%), Overpressure Rupture (21.4%), and Rescue & EMS (6.5%).
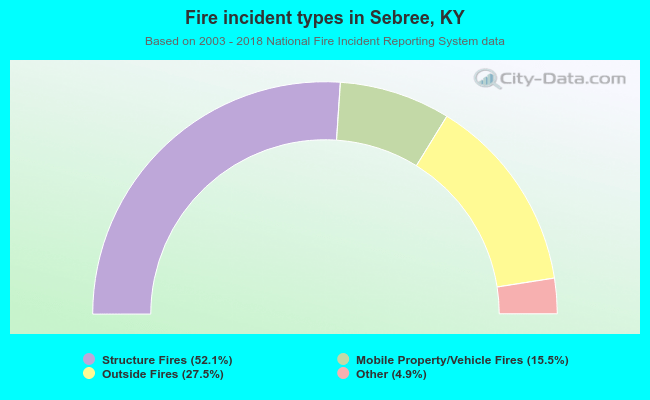 When looking into fire subcategories, the most incidents belonged to: Structure Fires (52.1%), and Outside Fires (27.5%).