Sesser: Fire Incidents, Illinois (IL)
Where are fire incidents reported in Sesser, IL
Something went wrong! Please refresh the page.
|
| |||||||||||||||||||||||||||||||||||||||||||||||||||||||||||||||||||||||||||||||||||||||||||||||||||||||||||||
2002 - 2018 National Fire Incident Reporting System (NFIRS) incidents
- Incident types reported to NFIRS in Sesser, IL
- 94358.6%Rescue & EMS
- 39824.7%Fire
- 1006.2%Hazardous Condition
- 613.8%Service Call
- 362.2%Good Intent Call
- 362.2%False Alarm
- 241.5%Special Incident
- 120.7%Severe Weather
- Fire incident types reported to NFIRS in Sesser, IL
- 20250.8%Structure Fires
- 13634.2%Outside Fires
- 4411.1%Mobile Property/Vehicle Fires
- 164.0%Other
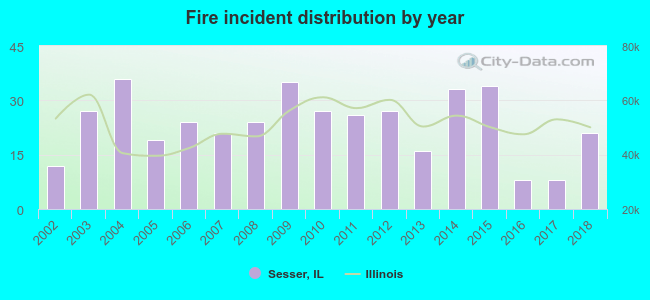 Based on the data from the years 2002 - 2018 the average number of fires per year is 23. The highest number of reported fires - 36 took place in 2004, and the least - 8 in 2016. The data has a rising trend.
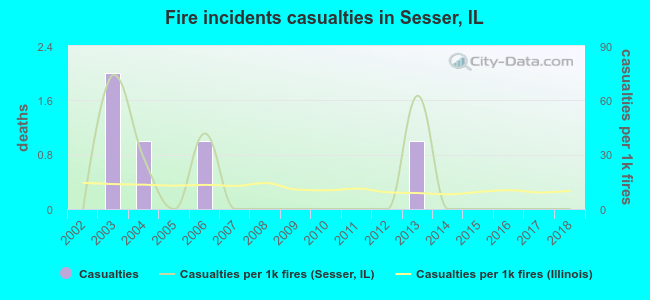 According to the data from the years 2002 - 2018 the average number of fire-related yearly casualties is 0. The highest number of reported casualties - 2 took place in 2003, and the lowest - 0 in 2002. The data has a constant trend.
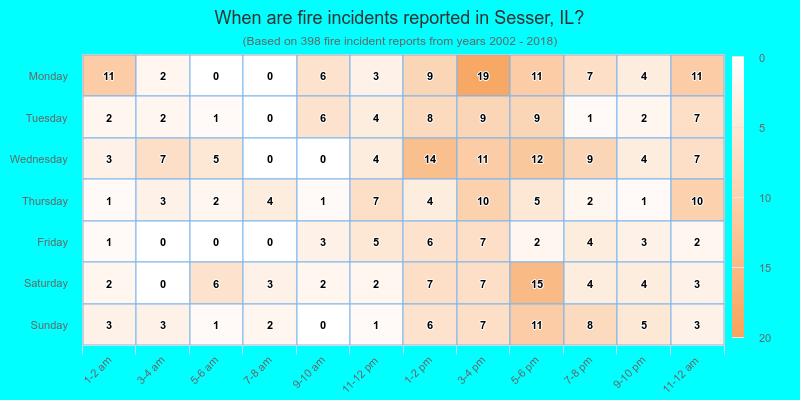
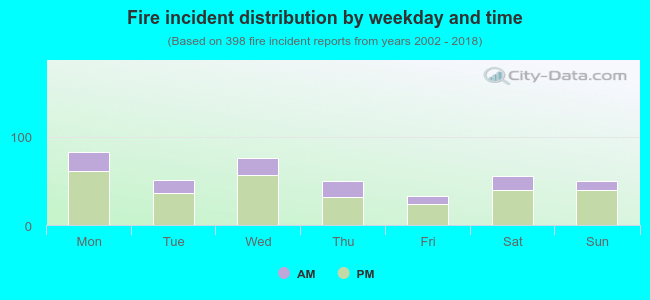 27.1% incidents where reported in the morning and 72.9% in the evening. The most fires (20.9%) took place on Monday, and the least (8.3%) on Friday.
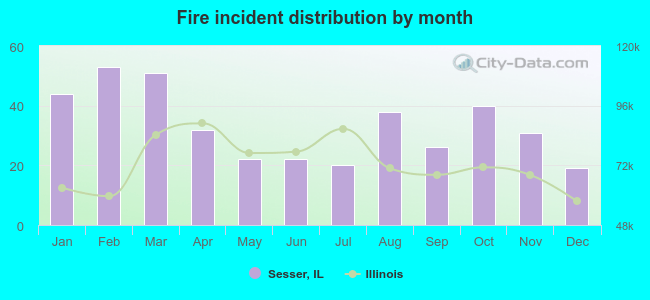 According to the 398 reports from years 2002 - 2018 most fires (13.3%) took place during February, and the least (4.8%) in December.
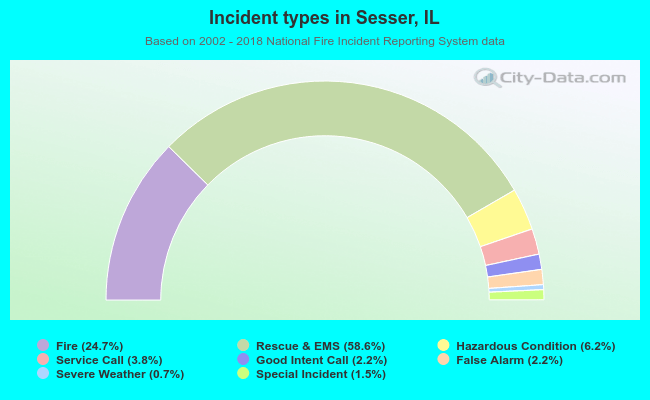 Out of all 1,610 cases reported during the years 2002 - 2018, the most belonged to the categories: Overpressure Rupture (58.6%), Fire (24.7%), and Rescue & EMS (6.2%).
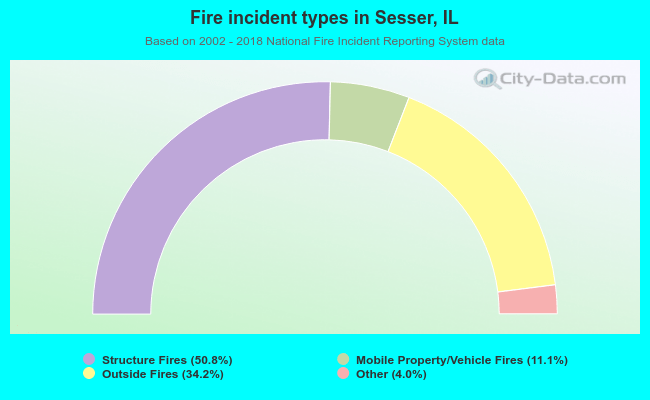 When looking into fire subcategories, the most incidents belonged to: Structure Fires (50.8%), and Outside Fires (34.2%).