Sharonville: Fire Incidents, Ohio (OH)
Where are fire incidents reported in Sharonville, OH
Something went wrong! Please refresh the page.
| Fire incidents reported | |
|---|---|
| Sreet name | Count |
| KEMPER RD | 212 |
| LEBANON RD | 174 |
| SHARON RD | 146 |
| CHESTER RD | 132 |
| READING RD | 124 |
| MOSTELLER RD | 110 |
| SHARON PARK LN | 108 |
| HAUCK RD | 98 |
| LIPPELMAN RD | 70 |
| CRESCENTVILLE RD | 64 |
| I 275 HWY | 60 |
| CREEK RD | 52 |
| TIMBER RIDGE LN | 44 |
| MIDPINES DR | 40 |
| CHAMPION WAY | 34 |
| SHARONDALE RD | 34 |
| COTTINGHAM DR | 28 |
| I 75 HWY | 28 |
| LIPPLEMAN | 26 |
| LEMARIE DR | 20 |
| LIPPLEMAN RD | 20 |
| RUNYAN DR | 20 |
| CORNELL RD | 18 |
| DOWLIN DR | 18 |
| FIELDS ERTEL RD | 18 |
| CANAL RD | 16 |
| CHESTERDALE RD | 16 |
| THORNVIEW DR | 16 |
| TRIANGLE PARK DR | 16 |
| BAINBRIDGE DR | 14 |
2002 - 2018 National Fire Incident Reporting System (NFIRS) incidents
- Incident types reported to NFIRS in Sharonville, OH
- 3,11531.1%Rescue & EMS
- 1,96319.6%False Alarm
- 1,77317.7%Hazardous Condition
- 1,61416.1%Fire
- 1,09711.0%Good Intent Call
- 3563.6%Service Call
- 420.4%Overpressure Rupture
- 290.3%Special Incident
- 180.2%Severe Weather
- Fire incident types reported to NFIRS in Sharonville, OH
- 80850.1%Structure Fires
- 42826.5%Outside Fires
- 37223.0%Mobile Property/Vehicle Fires
- 60.4%Other
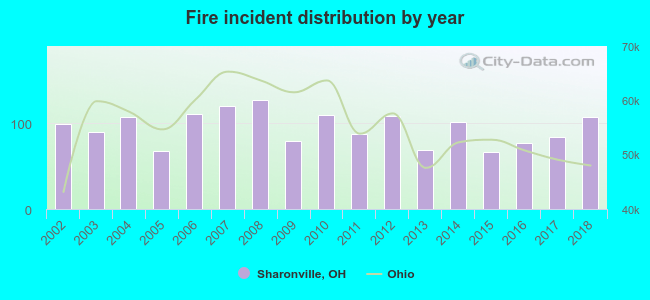 According to the data from the years 2002 - 2018 the average number of fires per year is 95. The highest number of reported fires - 127 took place in 2008, and the least - 67 in 2015. The data has a growing trend.
The average number of yearly fire incidents per 10k residents in Sharonville, OH compared to nearest cities:
(Note: Based on data for the last 3 years, including only cities with population 5,000 and above)
| Sharonville: | 65.8 |
| Blue Ash: | 53.8 |
| Montgomery: | 22.3 |
| Reading: | 56.7 |
| Springdale: | 78.8 |
| Deer Park: | 26.9 |
| Wyoming: | 21.0 |
| Forest Park: | 42.0 |
| Madeira: | 11.9 |
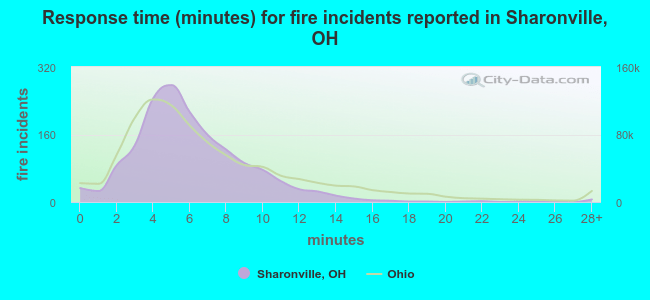 The median response time based on all reported fire incidents is 6 minutes. This is comparable to the Ohio median value.
The median response time in Sharonville, OH compared to nearest cities:
(Note: Based on data for all years, including only cities with at least 500 fire incidents)
| Sharonville: | 6 minutes |
| Blue Ash: | 5 minutes |
| Evendale: | 5 minutes |
| Montgomery: | 6 minutes |
| Lincoln Heights: | 5 minutes |
| Woodlawn: | 5 minutes |
| Reading: | 5 minutes |
| Springdale: | 5 minutes |
| Lockland: | 6 minutes |
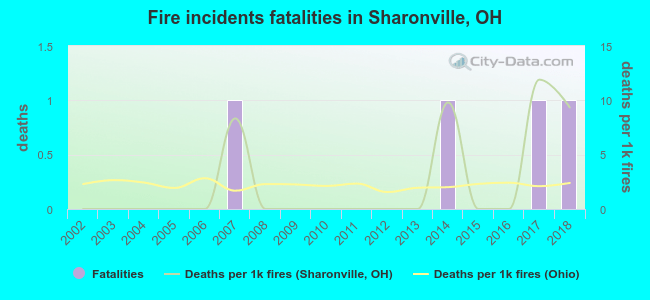 According to the reports from the years 2002 - 2018 the average number of fire-related fatalities per year is 0. The highest number of deaths - 1 took place in 2007, and the lowest - 0 in 2002. The data has a growing trend.
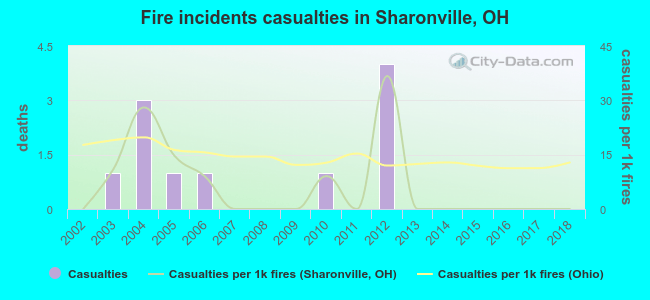 Based on the data from the years 2002 - 2018 the average number of fire-related yearly casualties is 1. The highest number of injuries - 4 took place in 2012, and the lowest - 0 in 2002. The data has a constant trend.
The average number of injuries per 1,000 fire incidents is 6. This indicator was the highest - 37 in 2012, and the lowest 0 in 2002. The trend for injuries per 1,000 fires is constant. Compared to the Ohio value the number of casualties per 1,000 fires is much lower.
Based on the data from the years 2002 - 2018 the average number of fire-related yearly casualties is 1. The highest number of injuries - 4 took place in 2012, and the lowest - 0 in 2002. The data has a constant trend.
The average number of injuries per 1,000 fire incidents is 6. This indicator was the highest - 37 in 2012, and the lowest 0 in 2002. The trend for injuries per 1,000 fires is constant. Compared to the Ohio value the number of casualties per 1,000 fires is much lower.Casualties per 1,000 incidents in Sharonville, OH compared to nearest cities:
(Note: Based on data for all years, including only cities with at least 500 fire incidents)
| Sharonville: | 6.8 |
| Blue Ash: | 25.6 |
| Evendale: | 3.7 |
| Montgomery: | 4.6 |
| Lincoln Heights: | 0.0 |
| Woodlawn: | 3.8 |
| Reading: | 40.6 |
| Springdale: | 21.1 |
| Lockland: | 11.9 |
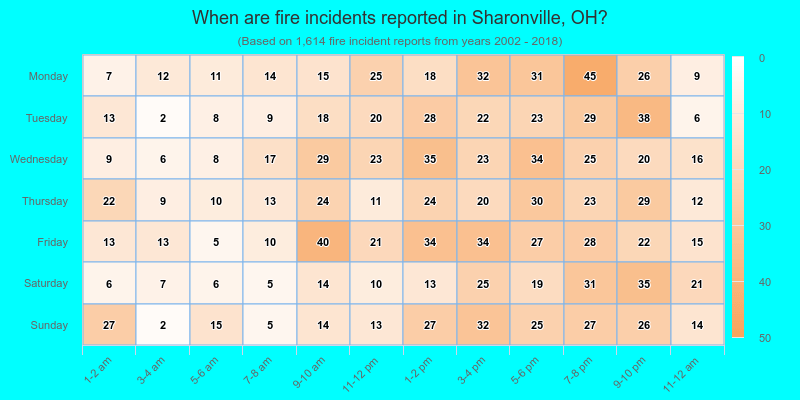
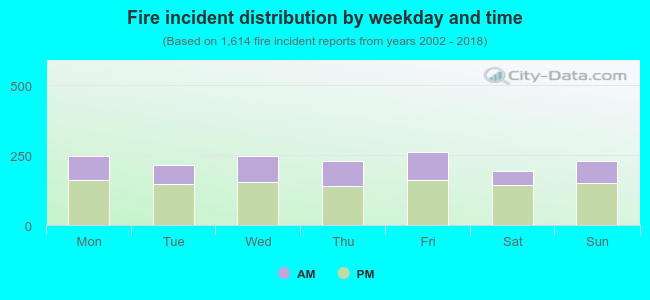 34.8% incidents where reported in the morning and 65.2% in the evening. The most fires (16.2%) took place on Friday, and the least (11.9%) on Saturday.
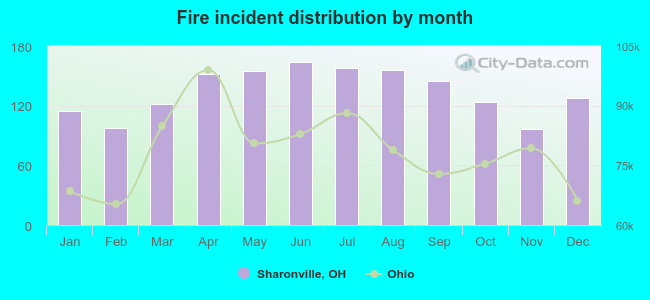 According to the 1,614 fire incidents from years 2002 - 2018 most fires (10.2%) took place during June, and the least (6.0%) in November.
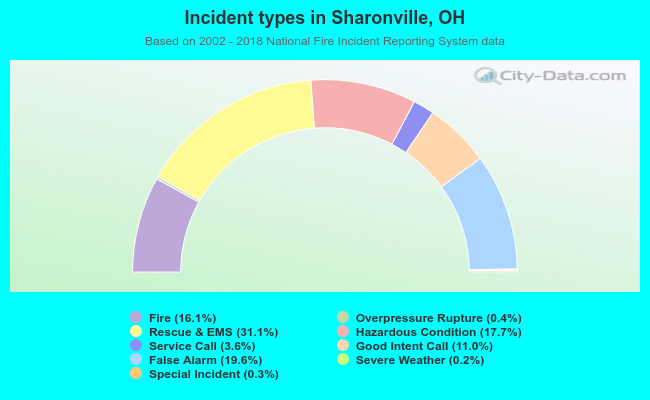 Out of all 10,007 cases reported during the years 2002 - 2018, the most belonged to the categories: Rescue & EMS (31.1%), False Alarm (19.6%), and Hazardous Condition (17.7%).
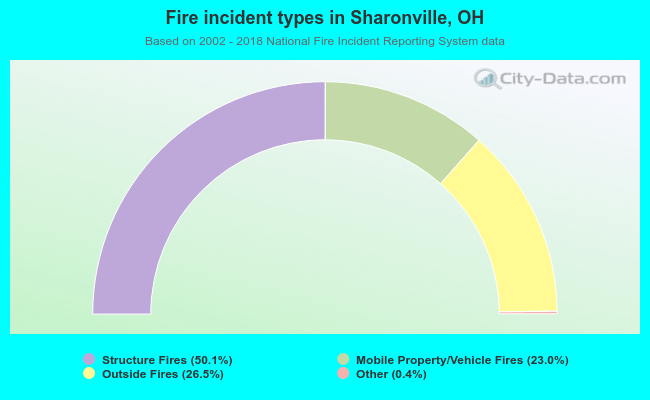 When looking into fire subcategories, the most incidents belonged to: Structure Fires (50.1%), and Outside Fires (26.5%).