| Fire incidents reported |
|---|
| Sreet name | Count |
|---|
| FLEEBURG RD | 34 | | THIRD ST | 22 | | GROVE HILL RIVER RD | 18 | | SECOND ST | 16 | | SHIPWRECK RD | 14 | | JOLLETT RD | 12 | | NEWPORT RD | 12 | | RIDGE VIEW LN | 12 | | US 340 HWY | 12 | | US HIGHWAY 340 | 12 | | COBBLESTONE LN | 10 | | COMERTOWN RD | 10 | | FIFTH ST | 10 | | FIRST ST | 10 | | JUNIOR AVE | 8 | | LIZARD HILL RD | 8 | | NEWPORT ROAD | 8 | | NEWPORT ROAD RD | 8 | | SHENANDOAH RIVER RD | 8 | | SHENANDOAH RIVER ROAD | 8 | | 1044 WILDWOOD LANE | 6 | | CROOKED RUN RD | 6 | | FOURTH ST | 6 | | INGHAM LN | 6 | | MCDANIEL LN | 6 |
| | | Fire incidents reported |
|---|
| Sreet name | Count |
|---|
| PANTHER DR | 6 | | PAUL LN | 6 | | RINACAS CORNER RD | 6 | | STEAM HOLLOW RD | 6 | | STROLE FARM RD | 6 | | 102 GRANDOS STREET | 4 | | 1027 RAMONA AVE LGTS | 4 | | 10TH ST | 4 | | 1ST ST | 4 | | 311 EDGEWOOD DRIVE | 4 | | 484 TRENTON AVE | 4 | | 484 TRENTON AVE LGTS | 4 | | 743 LOOP ROAD | 4 | | BANK ST | 4 | | ERNIES LN | 4 | | FERRELL LN | 4 | | FLEEBURG | 4 | | FLEEBURG LOOP | 4 | | KEMBLE SPRING LN | 4 | | LIBERTY AVE | 4 | | LOOP RD | 4 | | MARYLAND AVE | 4 | | MILNES RD | 4 | | MORRISON ROAD | 4 | | PARK VIEW | 4 |
|
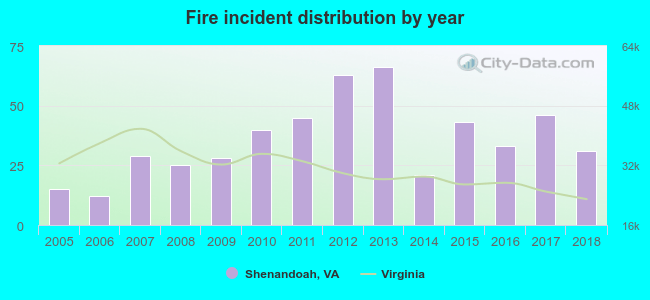 Based on the data from the years 2005 - 2018 the average number of fires per year is 36. The highest number of reported fire incidents - 66 took place in 2013, and the least - 12 in 2006. The data has a rising trend.
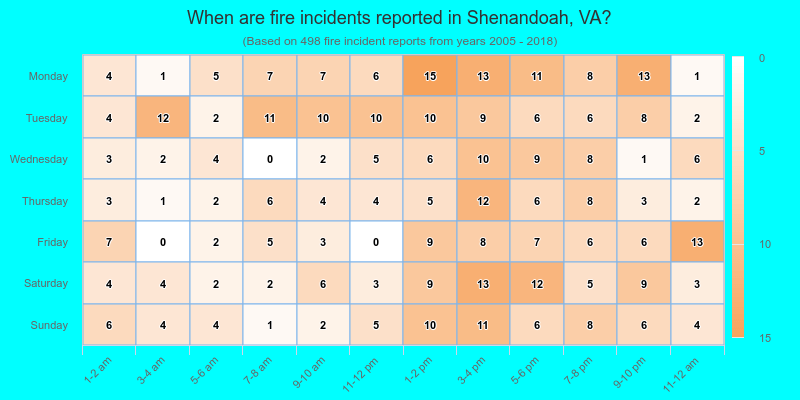
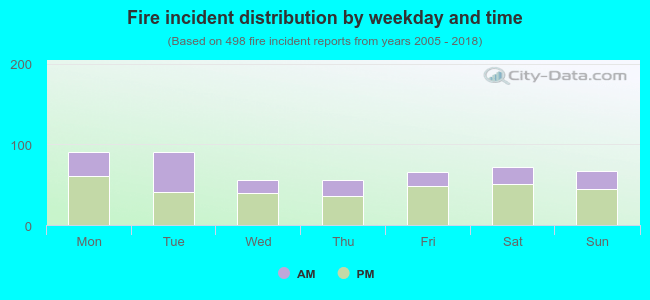 35.1% incidents where reported in the morning and 64.9% in the evening. The most fires (18.3%) took place on Monday, and the least (11.2%) on Wednesday.
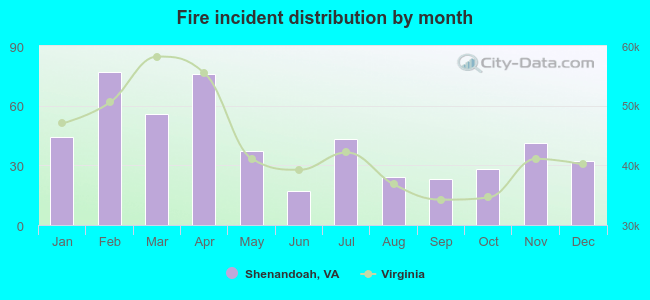 According to the 498 fires from years 2005 - 2018 most fires (15.5%) took place during February, and the least (3.4%) in June.
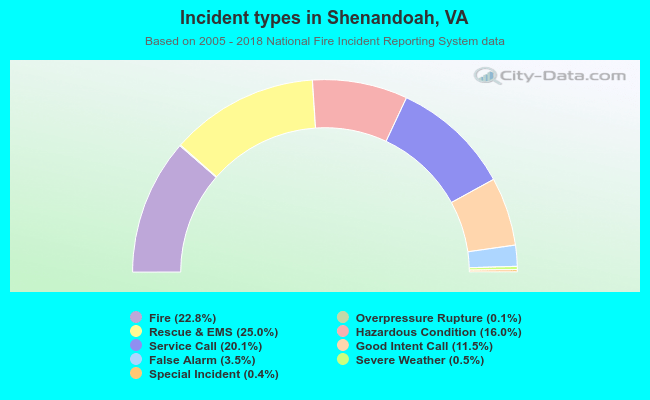 Out of all 2,182 cases reported during the years 2005 - 2018, the most belonged to the categories: Rescue & EMS (25.0%), Fire (22.8%), and Service Call (20.1%).
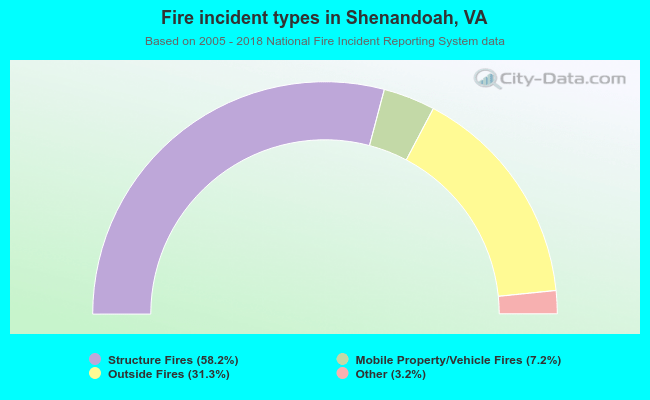 When looking into fire subcategories, the most reports belonged to: Structure Fires (58.2%), and Outside Fires (31.3%).