Sherman: Fire Incidents, Illinois (IL)
Where are fire incidents reported in Sherman, IL
Something went wrong! Please refresh the page.
|
| |||||||||||||||||||||||||||||||||||||||||||||||||||||||||||||||||||||||||||||||||||||||||||||||||||||||||||||
2002 - 2018 National Fire Incident Reporting System (NFIRS) incidents
- Incident types reported to NFIRS in Sherman, IL
- 1,15347.0%Rescue & EMS
- 52021.2%Fire
- 24510.0%Good Intent Call
- 2008.2%False Alarm
- 1927.8%Hazardous Condition
- 1315.3%Service Call
- 90.4%Severe Weather
- 30.1%Overpressure Rupture
- Fire incident types reported to NFIRS in Sherman, IL
- 24547.1%Outside Fires
- 17433.5%Structure Fires
- 9117.5%Mobile Property/Vehicle Fires
- 101.9%Other
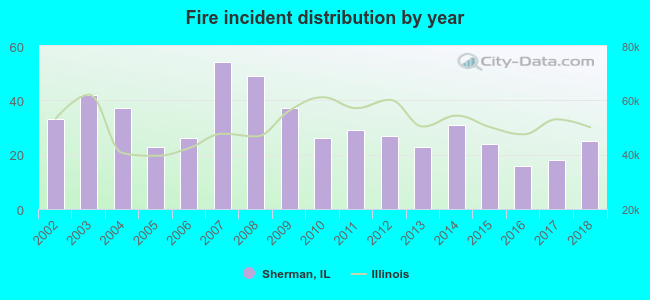 Based on the data from the years 2002 - 2018 the average number of fire incidents per year is 31. The highest number of fires - 54 took place in 2007, and the least - 16 in 2016. The data has a decreasing trend.
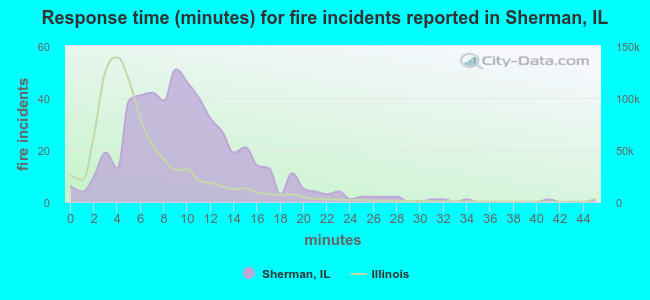 The median response time based on all reported fire incidents is 9 minutes. This is higher than the Illinois median value.
The median response time in Sherman, IL compared to nearest cities:
(Note: Based on data for all years, including only cities with at least 500 fire incidents)
| Sherman: | 9 minutes |
| Springfield: | 5 minutes |
| Petersburg: | 9 minutes |
| Chatham: | 6 minutes |
| Lincoln: | 5 minutes |
| Taylorville: | 6 minutes |
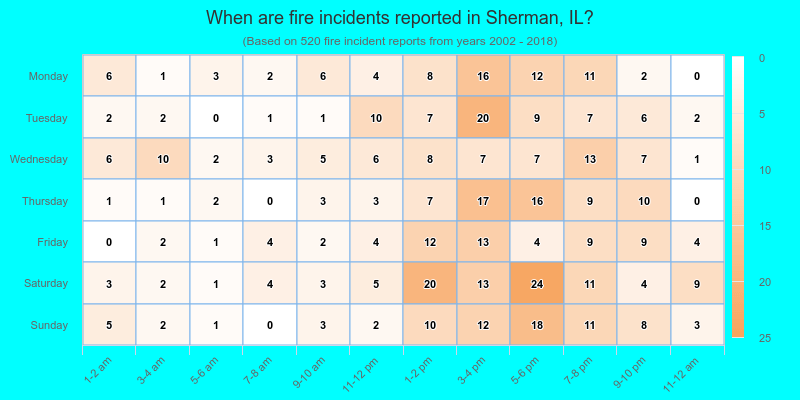
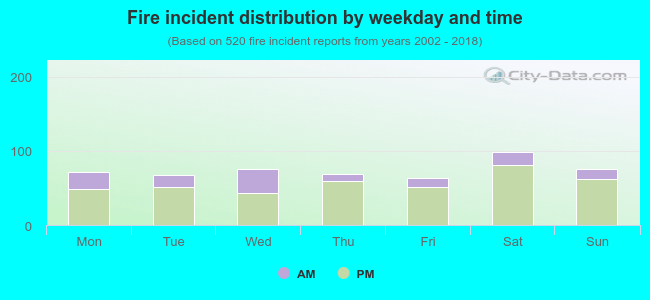 23.8% incidents where reported in the morning and 76.2% in the evening. The most fires (19.0%) took place on Saturday, and the least (12.3%) on Friday.
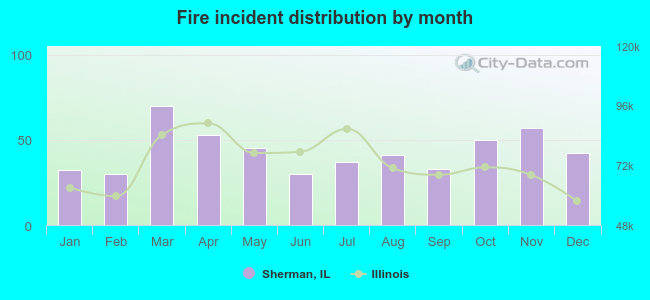 According to the 520 fire incidents from years 2002 - 2018 most fires (13.5%) took place during March, and the least (5.8%) in February.
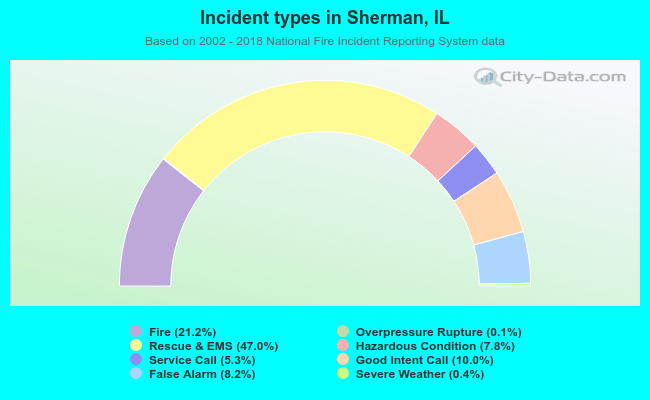 Out of all 2,453 cases reported during the years 2002 - 2018, the most belonged to the categories: Rescue & EMS (47.0%), Fire (21.2%), and Good Intent Call (10.0%).
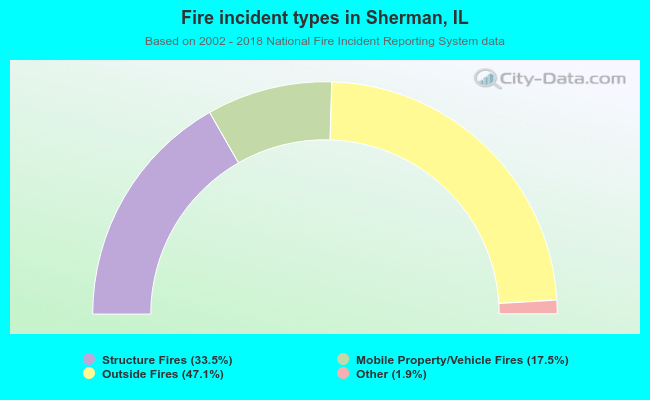 When looking into fire subcategories, the most incidents belonged to: Outside Fires (47.1%), and Structure Fires (33.5%).