Soledad: Fire Incidents, California (CA)
Where are fire incidents reported in Soledad, CA
Something went wrong! Please refresh the page.
|
| |||||||||||||||||||||||||||||||||||||||||||||||||||||||||||||||||||||||||||||||||||||||||||||||||||||||||||||
2005 - 2018 National Fire Incident Reporting System (NFIRS) incidents
- Incident types reported to NFIRS in Soledad, CA
- 61030.7%Rescue & EMS
- 60030.2%Fire
- 30815.5%Good Intent Call
- 22811.5%Hazardous Condition
- 1196.0%Service Call
- 1196.0%False Alarm
- 20.1%Special Incident
- Fire incident types reported to NFIRS in Soledad, CA
- 29849.7%Outside Fires
- 17629.3%Structure Fires
- 9816.3%Mobile Property/Vehicle Fires
- 284.7%Other
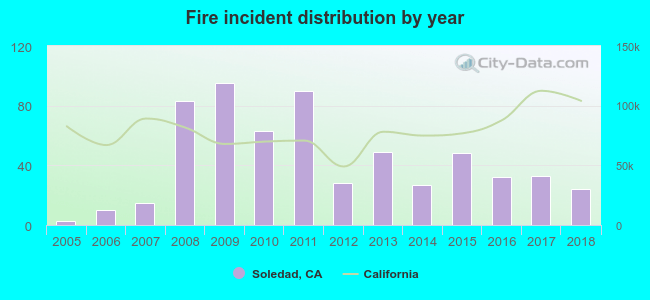 According to the data from the years 2005 - 2018 the average number of fire incidents per year is 43. The highest number of reported fire incidents - 95 took place in 2009, and the least - 3 in 2005. The data has a growing trend.
The average number of yearly fire incidents per 10k residents in Soledad, CA compared to nearest cities:
(Note: Based on data for the last 3 years, including only cities with population 5,000 and above)
| Soledad: | 11.7 |
| Gonzales: | 3.6 |
| Greenfield: | 50.4 |
| King City: | 12.8 |
| Carmel Valley: | 19.7 |
| Salinas: | 20.1 |
| Hollister: | 26.9 |
| Seaside: | 14.8 |
| Marina: | 29.8 |
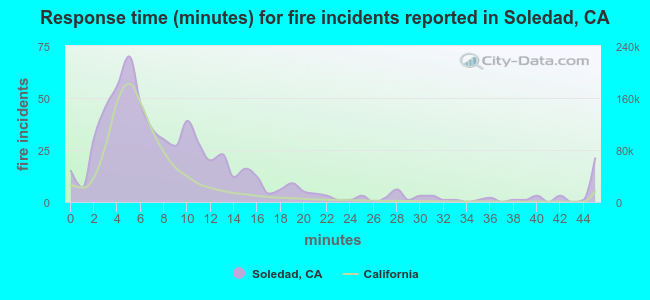 The median response time based on all reported fire incidents is 7 minutes. This is similar to the California median value.
The median response time in Soledad, CA compared to nearest cities:
(Note: Based on data for all years, including only cities with at least 500 fire incidents)
| Soledad: | 7 minutes |
| Greenfield: | 6 minutes |
| Salinas: | 7 minutes |
| Hollister: | 7 minutes |
| Seaside: | 4 minutes |
| Marina: | 6 minutes |
| Prunedale: | 8 minutes |
| Monterey: | 4 minutes |
| Watsonville: | 11 minutes |
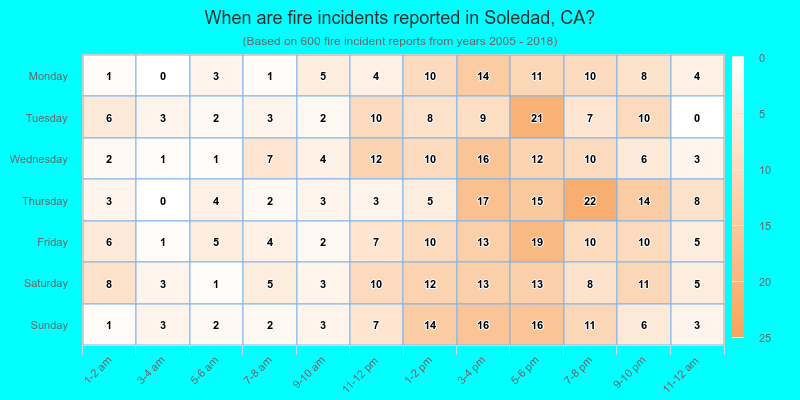
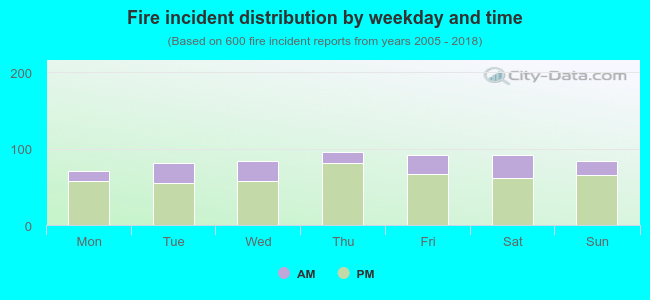 25.8% incidents where reported in the morning and 74.2% in the evening. The most fires (16.0%) took place on Thursday, and the least (11.8%) on Monday.
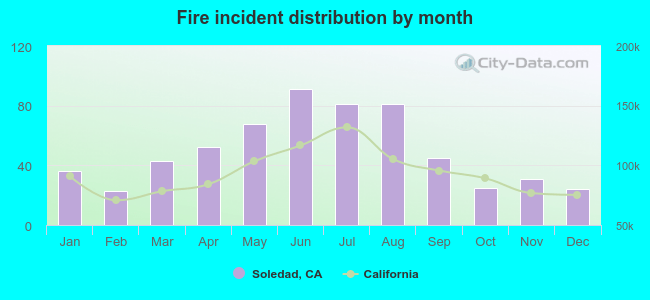 According to the 600 fire incidents from years 2005 - 2018 most fires (15.2%) took place during June, and the least (3.8%) in February.
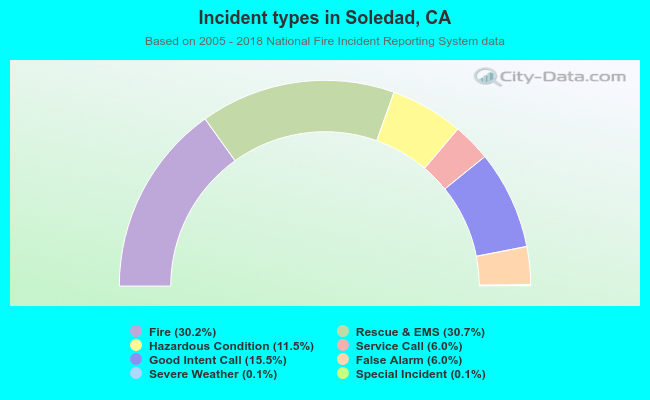 Out of all 1,987 cases reported during the years 2005 - 2018, the most belonged to the categories: Overpressure Rupture (30.7%), Fire (30.2%), and Service Call (15.5%).
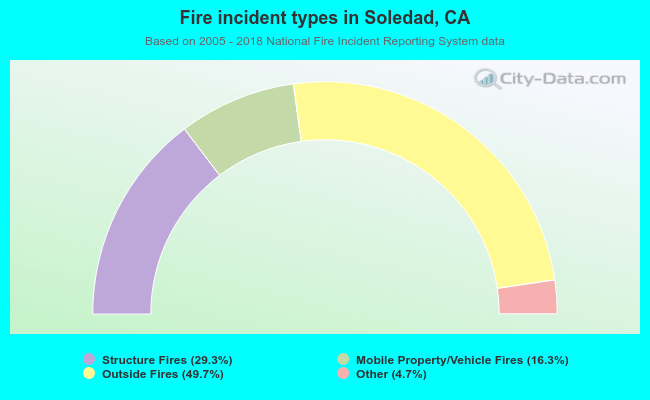 When looking into fire subcategories, the most incidents belonged to: Outside Fires (49.7%), and Structure Fires (29.3%).