South Bend: Fire Incidents, Washington (WA)
Where are fire incidents reported in South Bend, WA
Something went wrong! Please refresh the page.
|
| |||||||||||||||||||||||||||||||||||||||||||||||||||||||||||||||||||||||||||||||||||||||||||||||||||||||||||||
2003 - 2018 National Fire Incident Reporting System (NFIRS) incidents
- Incident types reported to NFIRS in South Bend, WA
- 1,92890.3%Rescue & EMS
- 1205.6%Fire
- 472.2%Good Intent Call
- 271.3%Hazardous Condition
- 80.4%False Alarm
- 40.2%Service Call
- Fire incident types reported to NFIRS in South Bend, WA
- 8066.7%Structure Fires
- 2117.5%Outside Fires
- 1210.0%Mobile Property/Vehicle Fires
- 75.8%Other
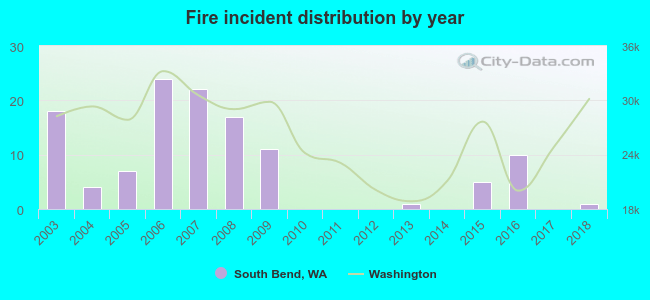 According to the data from the years 2003 - 2018 the average number of fire incidents per year is 8. The highest number of fires - 24 took place in 2006, and the least - 0 in 2010. The data has a declining trend.
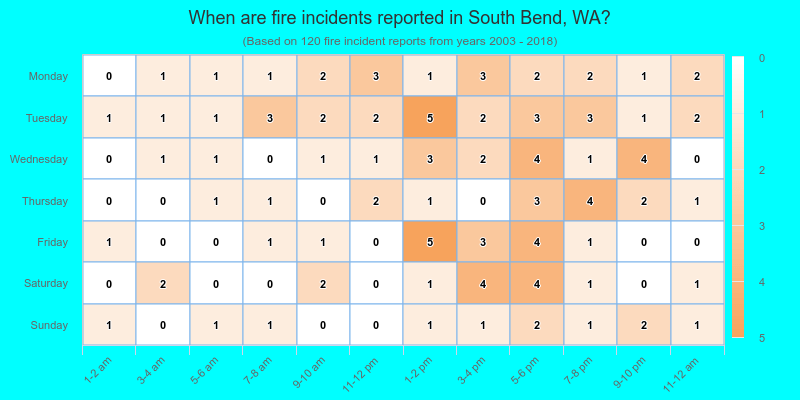
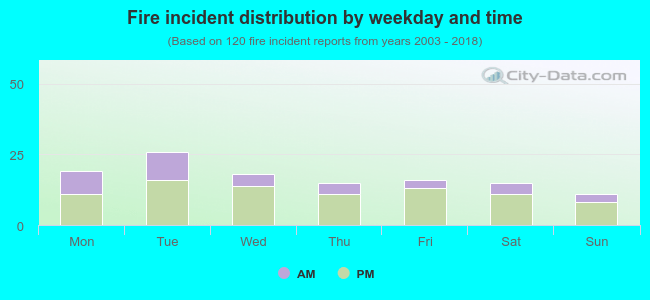 30.0% incidents where reported in the morning and 70.0% in the evening. The most fires (21.7%) took place on Tuesday, and the least (9.2%) on Sunday.
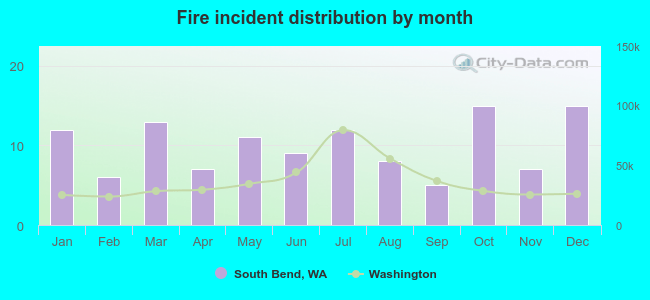 According to the 120 fire incident reports from years 2003 - 2018 most fires (12.5%) took place during October, and the least (4.2%) in September.
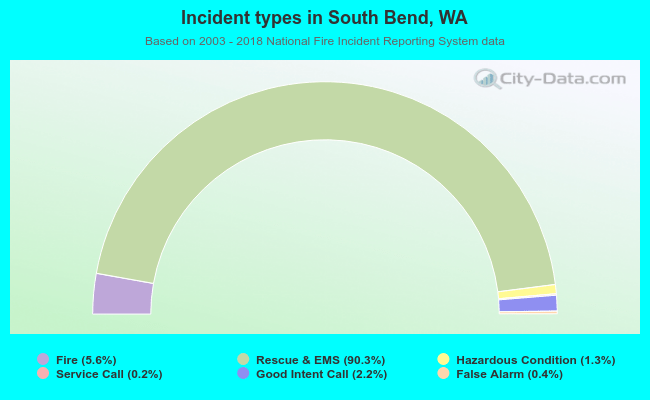 Out of all 2,134 cases reported during the years 2003 - 2018, the most belonged to the categories: Overpressure Rupture (90.3%), Fire (5.6%), and Service Call (2.2%).
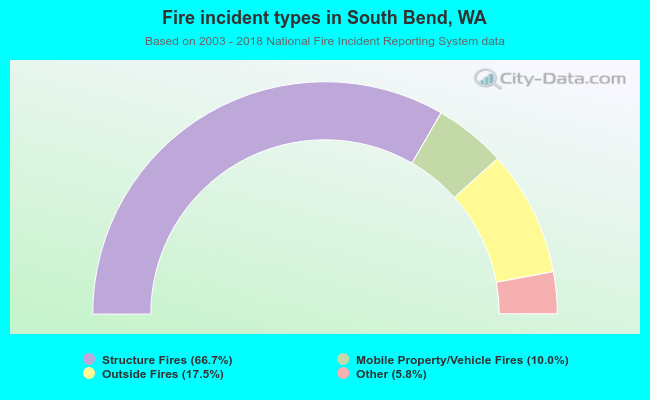 When looking into fire subcategories, the most reports belonged to: Structure Fires (66.7%), and Outside Fires (17.5%).