South Lebanon: Fire Incidents, Ohio (OH)
Where are fire incidents reported in South Lebanon, OH
Something went wrong! Please refresh the page.
|
| |||||||||||||||||||||||||||||||||||||||||||||||||||||||||||||||||||||||||||||||||||||||||||||||||||||||||||||
2002 - 2018 National Fire Incident Reporting System (NFIRS) incidents
- Incident types reported to NFIRS in South Lebanon, OH
- 2,41759.5%Rescue & EMS
- 40910.1%Hazardous Condition
- 3859.5%Fire
- 3689.1%Good Intent Call
- 2385.9%Service Call
- 2215.4%False Alarm
- 130.3%Severe Weather
- 80.2%Special Incident
- Fire incident types reported to NFIRS in South Lebanon, OH
- 17746.0%Structure Fires
- 16542.9%Outside Fires
- 389.9%Mobile Property/Vehicle Fires
- 51.3%Other
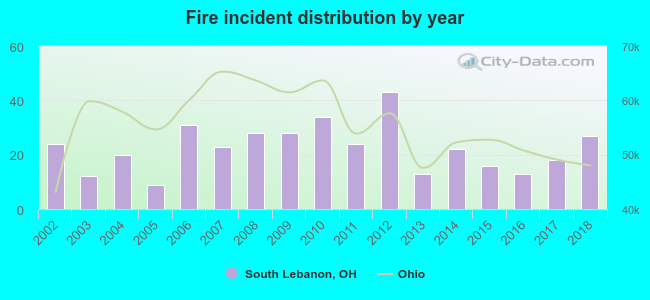 According to the data from the years 2002 - 2018 the average number of fires per year is 23. The highest number of fire incidents - 43 took place in 2012, and the least - 9 in 2005. The data has an increasing trend.
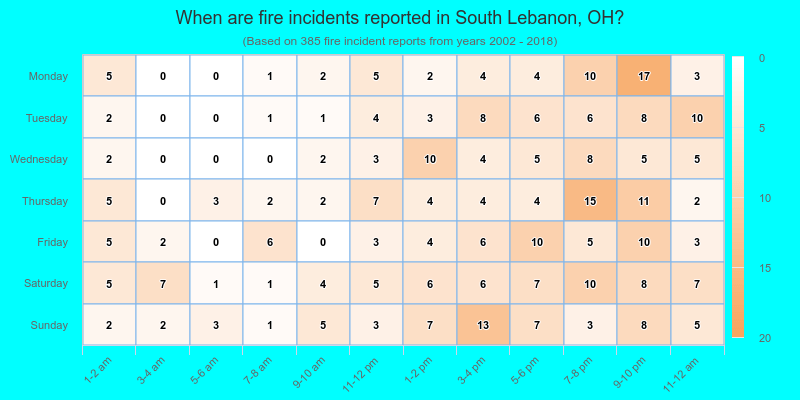
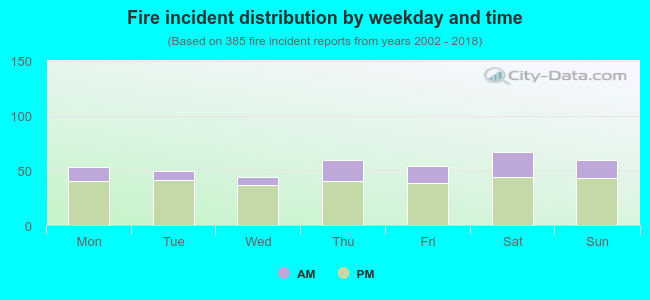 26.5% incidents where reported in the morning and 73.5% in the evening. The most fires (17.4%) took place on Saturday, and the least (11.4%) on Wednesday.
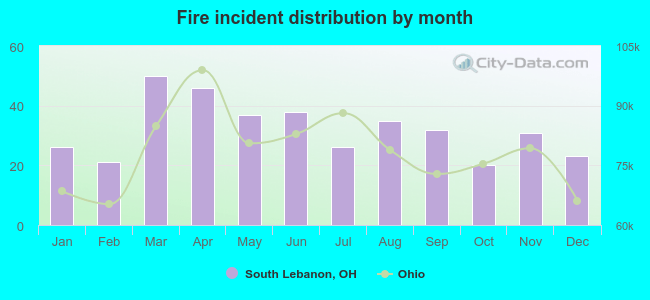 Based on the 385 reports from years 2002 - 2018 most fires (13.0%) took place during March, and the least (5.2%) in October.
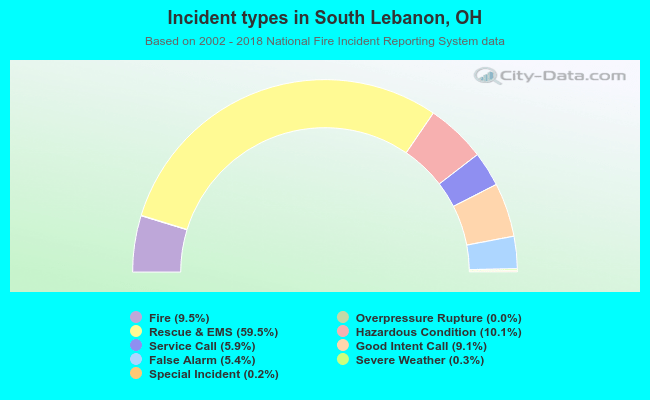 Out of all 4,061 cases reported during the years 2002 - 2018, the most belonged to the categories: Rescue & EMS (59.5%), Hazardous Condition (10.1%), and Fire (9.5%).
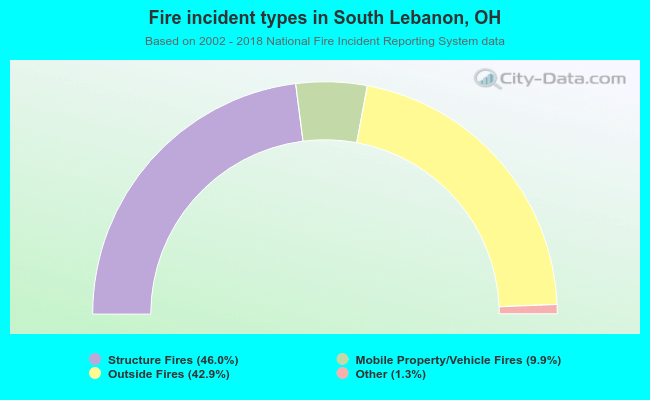 When looking into fire subcategories, the most incidents belonged to: Structure Fires (46.0%), and Outside Fires (42.9%).