Southside: Fire Incidents, Alabama (AL)
Where are fire incidents reported in Southside, AL
Something went wrong! Please refresh the page.
|
| |||||||||||||||||||||||||||||||||||||||||||||||||||||||||||||||||||||||||||||||||||||||||||||||||||||||||||||
2004 - 2018 National Fire Incident Reporting System (NFIRS) incidents
- Incident types reported to NFIRS in Southside, AL
- 1,84769.0%Rescue & EMS
- 35213.1%Service Call
- 1826.8%Good Intent Call
- 1485.5%Fire
- 602.2%False Alarm
- 572.1%Hazardous Condition
- 170.6%Severe Weather
- 110.4%Special Incident
- 40.1%Overpressure Rupture
- Fire incident types reported to NFIRS in Southside, AL
- 7752.0%Outside Fires
- 4530.4%Structure Fires
- 2013.5%Mobile Property/Vehicle Fires
- 64.1%Other
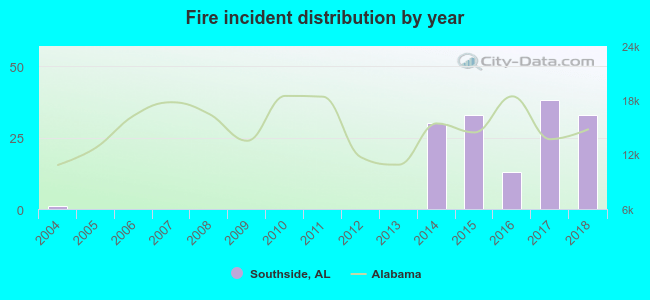 Based on the data from the years 2004 - 2018 the average number of fire incidents per year is 10. The highest number of reported fires - 38 took place in 2017, and the least - 0 in 2005. The data has a growing trend.
The average number of yearly fire incidents per 10k residents in Southside, AL compared to nearest cities:
(Note: Based on data for the last 3 years, including only cities with population 5,000 and above)
| Southside: | 32.7 |
| Rainbow City: | 50.3 |
| Glencoe: | 85.7 |
| Gadsden: | 58.5 |
| Attalla: | 42.6 |
| Jacksonville: | 66.4 |
| Anniston: | 119.9 |
| Boaz: | 86.4 |
| Lincoln: | 170.9 |
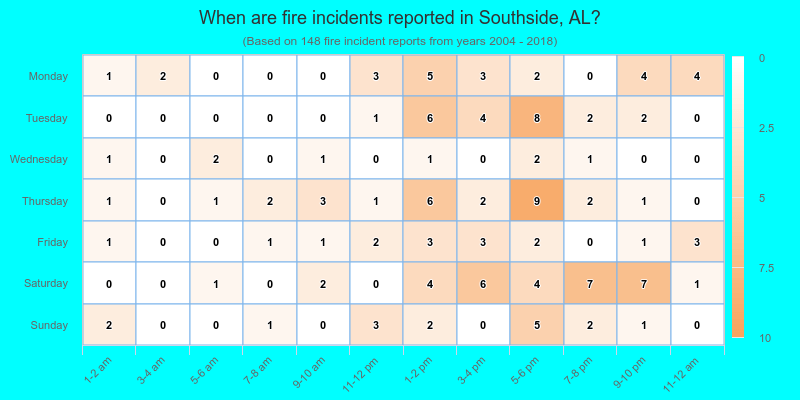
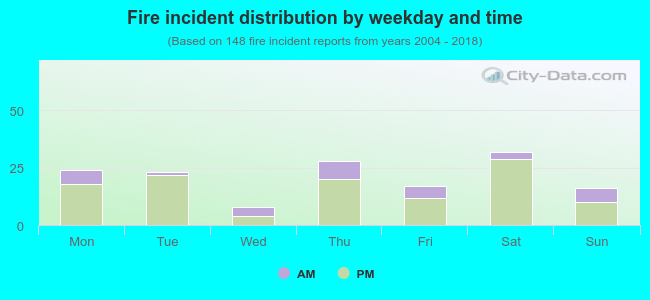 22.3% incidents where reported in the morning and 77.7% in the evening. The most fires (21.6%) took place on Saturday, and the least (5.4%) on Wednesday.
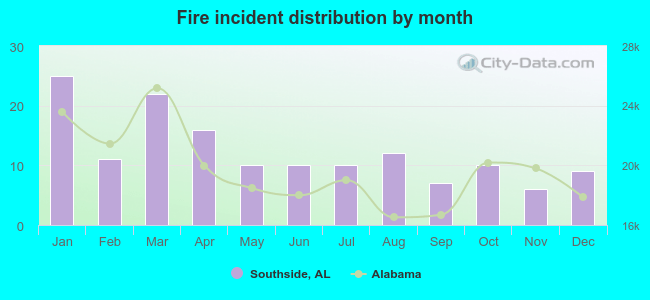 According to the 148 reports from years 2004 - 2018 most fires (16.9%) took place during January, and the least (4.1%) in November.
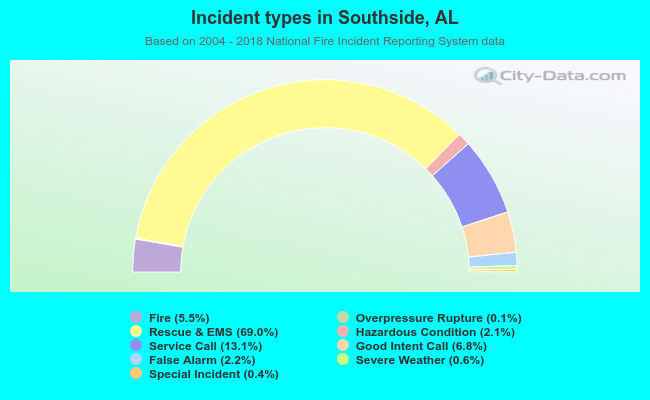 Out of all 2,678 cases reported during the years 2004 - 2018, the most belonged to the categories: Rescue & EMS (69.0%), Service Call (13.1%), and Good Intent Call (6.8%).
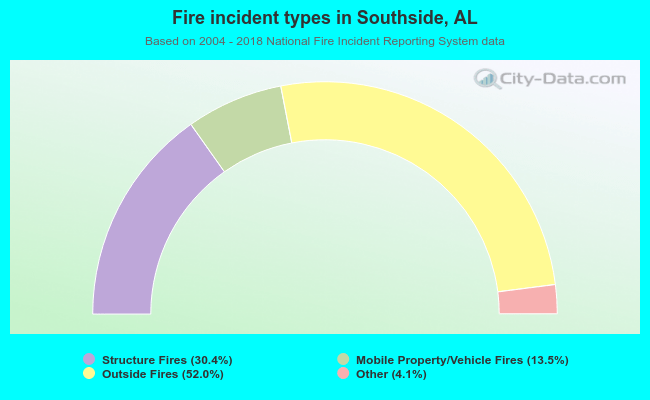 When looking into fire subcategories, the most incidents belonged to: Outside Fires (52.0%), and Structure Fires (30.4%).