| Fire incidents reported |
|---|
| Sreet name | Count |
|---|
| HIGHWAY 15 SOUTH | 10 | | HIGHWAY 15 NORTH | 6 | | HIGHWAY 22 WEST | 6 | | HWY 16 | 6 | | P.O. BOX 339 | 6 | | WARREN CHAPEL ROAD | 6 | | BOONE ROAD | 4 | | CARRS STATION RD | 4 | | CODY JOHNSON RD | 4 | | EAST BROAD ST | 4 | | JONES STREET ST | 4 | | LAKE SINCLAIR DR | 4 | | LINTON ROAD | 4 | | POWELTON AVE. | 4 | | SAM HILL ROAD | 4 | | SHIVERS GROVE RD | 4 | | WALLS ROAD | 4 | | .MAYFIELD RD | 2 | | 10741 HIGHWAY 16 W | 2 | | 10741 HIGHWAY 16 W. | 2 | | 175 ISLAND LAKE DR | 2 | | 1886 OLD EATONTON ROAD | 2 | | 23 GORDON STREET | 2 | | 2938 ISL CREEK CHURCH RD | 2 | | 3012 LAKE SINCLAIR DR | 2 |
| | | Fire incidents reported |
|---|
| Sreet name | Count |
|---|
| 3634 LINTON ROAD | 2 | | 400 SYCAMORE DR | 2 | | 407 MILHOUSE ROAD | 2 | | 4078 BIG WATER EAST RD | 2 | | 4276 BIG WATER EAST | 2 | | 4778 HIGHWAY 22 WEST | 2 | | 481 DIXIE STREET | 2 | | 51 SPARROW ROAD | 2 | | 65 SPARROW ROAD | 2 | | 701 PRISON BLVD. | 2 | | 701 PRISON BLVD | 2 | | 701 PRISON BLVD | 2 | | 896 LAKE SINCLAIR DRIVE | 2 | | 95 MAC WAY | 2 | | APRICOT LANE | 2 | | AUGUSTA HWY | 2 | | BALERMIA CHURCH ROAD | 2 | | BARON LANE | 2 | | BEALUAH HIGHWAY | 2 | | BEAULAH HIGHWAY | 2 | | BEAULAH HIGHWAY | 2 | | BEAULAH HIGHWAY | 2 | | BEAULAH ROAD | 2 | | BLACK OAK CT | 2 | | BLUE BIRD LN | 2 |
|
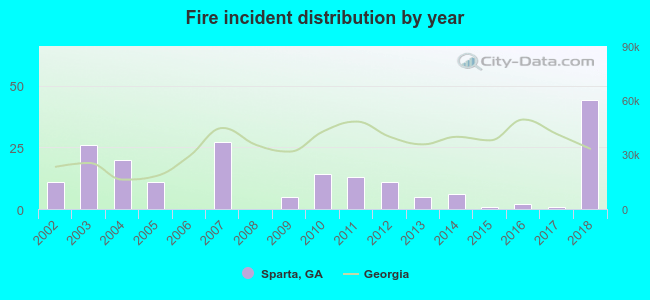 Based on the data from the years 2002 - 2018 the average number of fires per year is 12. The highest number of fires - 44 took place in 2018, and the least - 0 in 2006. The data has an increasing trend.
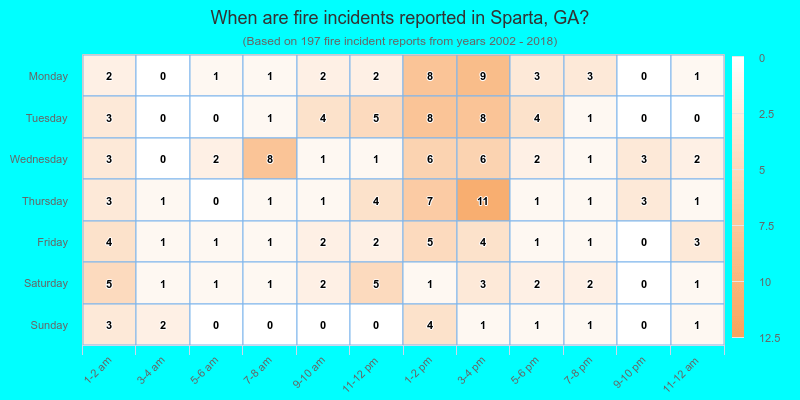
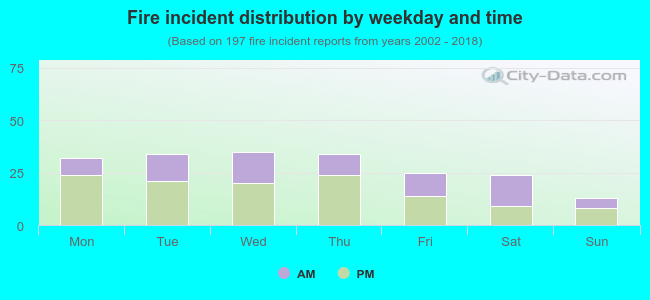 39.1% incidents where reported in the morning and 60.9% in the evening. The most fires (17.8%) took place on Wednesday, and the least (6.6%) on Sunday.
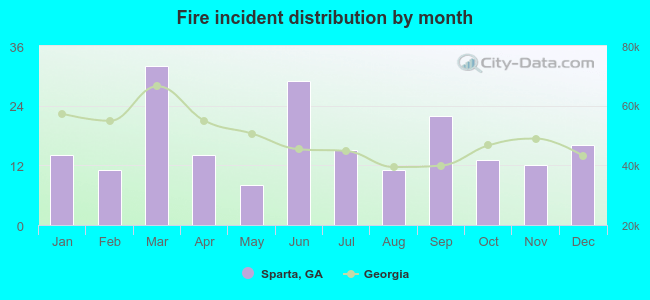 Based on the 197 fires from years 2002 - 2018 most fires (16.2%) took place during March, and the least (4.1%) in May.
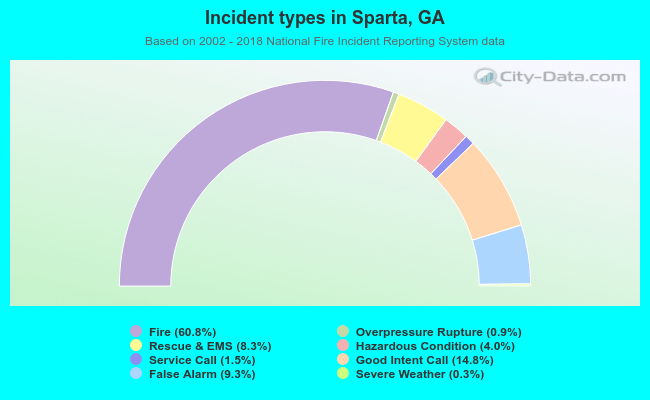 Out of all 324 cases reported during the years 2002 - 2018, the most belonged to the categories: Fire (60.8%), Good Intent Call (14.8%), and False Alarm (9.3%).
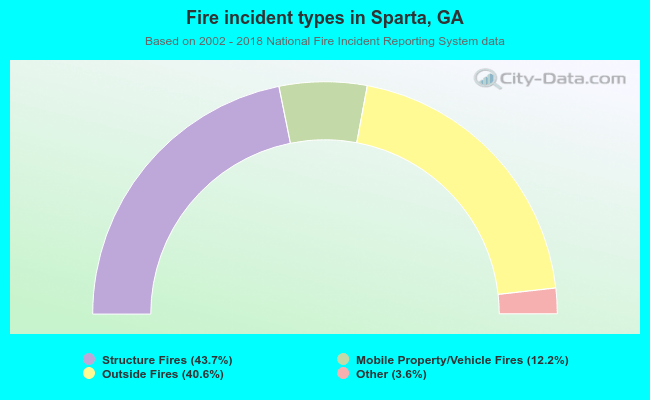 When looking into fire subcategories, the most reports belonged to: Structure Fires (43.7%), and Outside Fires (40.6%).