Spiceland: Fire Incidents, Indiana (IN)
Where are fire incidents reported in Spiceland, IN
Something went wrong! Please refresh the page.
|
| |||||||||||||||||||||||||||||||||||||||||||||||||||||||||||||||||||||||||||||||||||||||||||||||||||||||||||||
2002 - 2018 National Fire Incident Reporting System (NFIRS) incidents
- Incident types reported to NFIRS in Spiceland, IN
- 25134.6%Hazardous Condition
- 22130.4%Rescue & EMS
- 20728.5%Fire
- 263.6%False Alarm
- 141.9%Good Intent Call
- 71.0%Service Call
- Fire incident types reported to NFIRS in Spiceland, IN
- 8038.6%Outside Fires
- 6631.9%Structure Fires
- 6029.0%Mobile Property/Vehicle Fires
- 10.5%Other
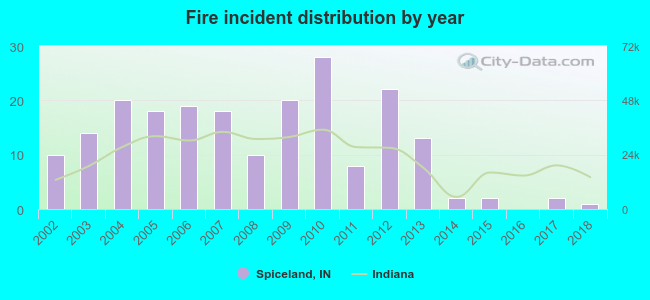 Based on the data from the years 2002 - 2018 the average number of fire incidents per year is 12. The highest number of fires - 28 took place in 2010, and the least - 0 in 2016. The data has a declining trend.
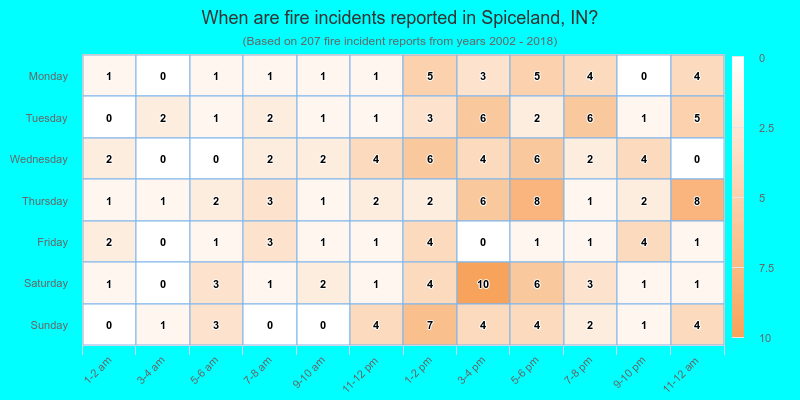
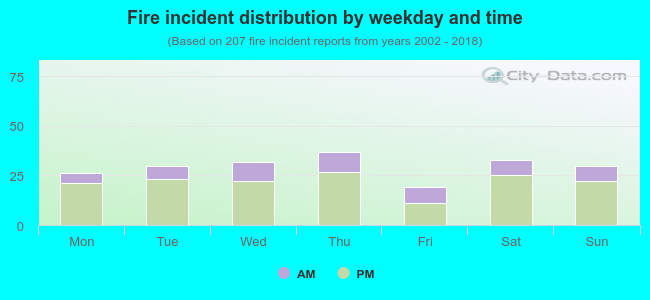 27.1% incidents where reported in the morning and 72.9% in the evening. The most fires (17.9%) took place on Thursday, and the least (9.2%) on Friday.
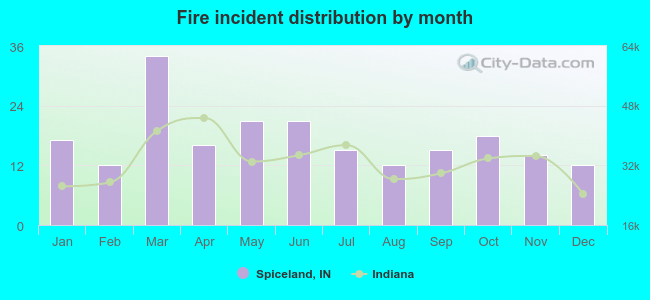 According to the 207 incident reports from years 2002 - 2018 most fires (16.4%) took place during March, and the least (5.8%) in February.
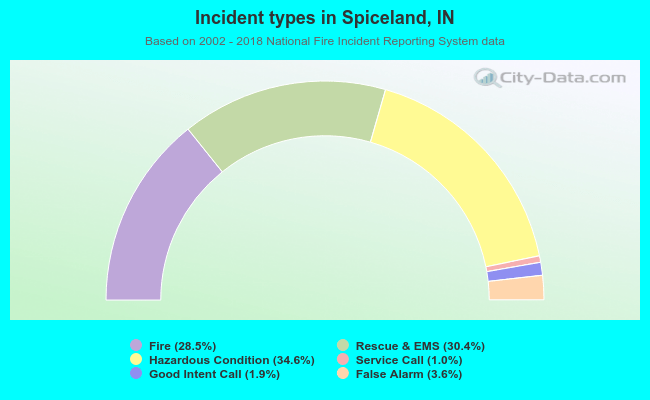 Out of all 726 cases reported during the years 2002 - 2018, the most belonged to the categories: Rescue & EMS (34.6%), Overpressure Rupture (30.4%), and Fire (28.5%).
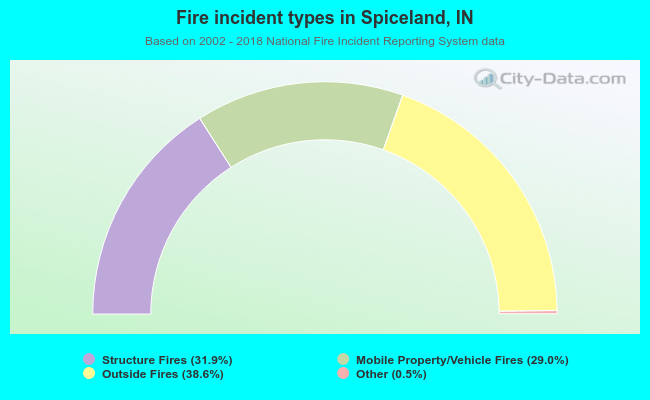 When looking into fire subcategories, the most incidents belonged to: Outside Fires (38.6%), and Structure Fires (31.9%).