St. Paul Park: Fire Incidents, Minnesota (MN)
Where are fire incidents reported in St. Paul Park, MN
Something went wrong! Please refresh the page.
|
| |||||||||||||||||||||||||||||||||||||||||||||||||||||||||||||||||||||||||||||||||||||||||||||||||||||||||||||
2002 - 2011 National Fire Incident Reporting System (NFIRS) incidents
- Incident types reported to NFIRS in St. Paul Park, MN
- 20145.3%Fire
- 15735.4%Hazardous Condition
- 368.1%False Alarm
- 245.4%Good Intent Call
- 204.5%Service Call
- 40.9%Rescue & EMS
- 10.2%Overpressure Rupture
- 10.2%Special Incident
- Fire incident types reported to NFIRS in St. Paul Park, MN
- 7939.3%Outside Fires
- 6934.3%Structure Fires
- 2813.9%Mobile Property/Vehicle Fires
- 2512.4%Other
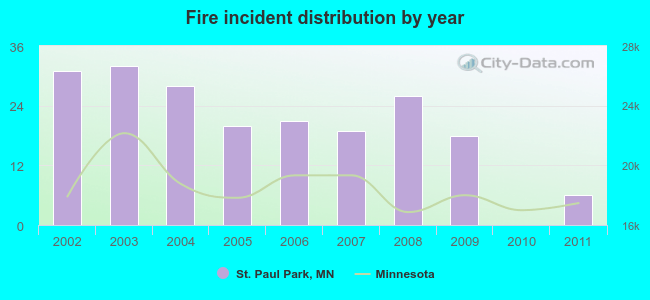 According to the data from the years 2002 - 2011 the average number of fire incidents per year is 20. The highest number of fire incidents - 32 took place in 2003, and the least - 0 in 2010. The data has a dropping trend.
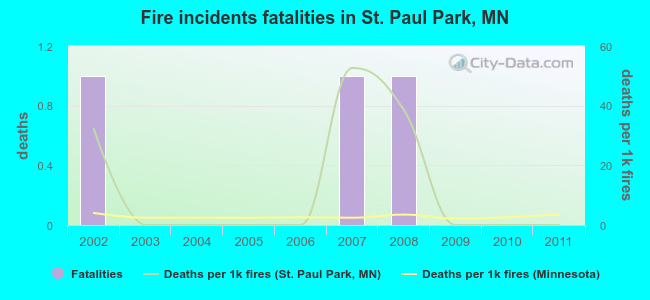 Based on the data from the years 2002 - 2011 the average number of fire-related fatalities per year is 0. The highest number of reported deaths - 1 took place in 2002, and the lowest - 0 in 2003. The data has a dropping trend.
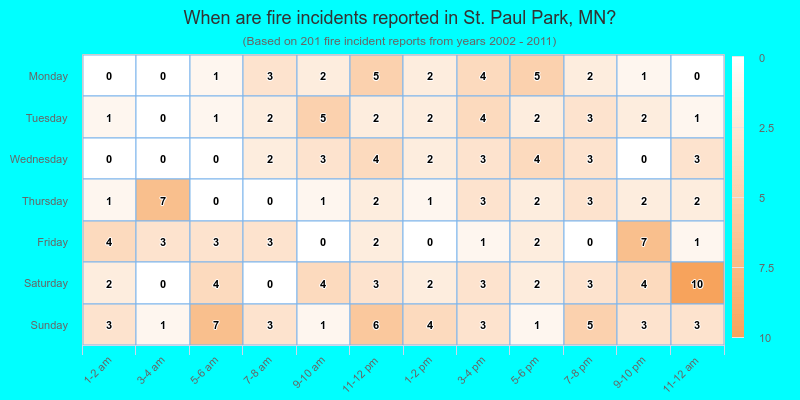
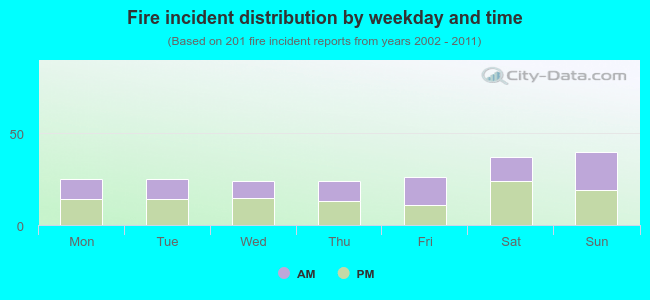 45.3% incidents where reported in the morning and 54.7% in the evening. The most fires (19.9%) took place on Sunday, and the least (11.9%) on Wednesday.
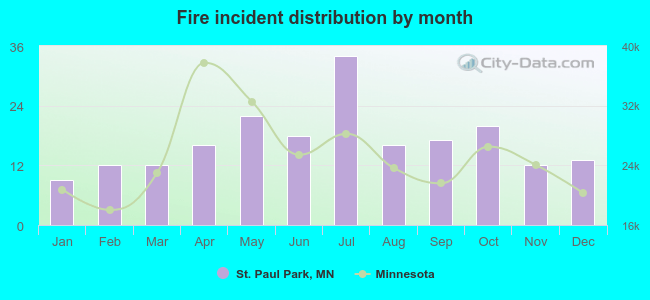 Based on the 201 fires from years 2002 - 2011 most fires (16.9%) took place during July, and the least (4.5%) in January.
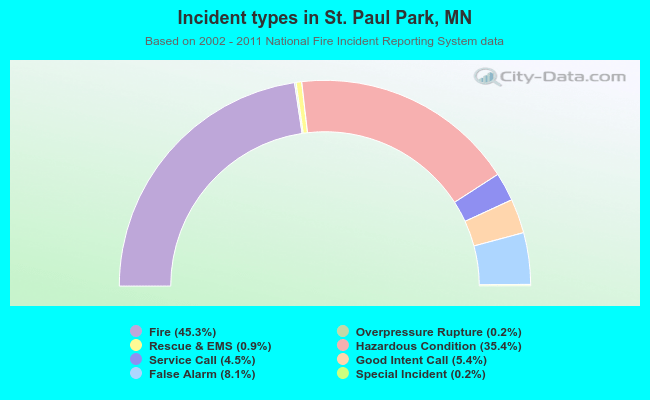 Out of all 444 cases reported during the years 2002 - 2011, the most belonged to the categories: Fire (45.3%), Hazardous Condition (35.4%), and False Alarm (8.1%).
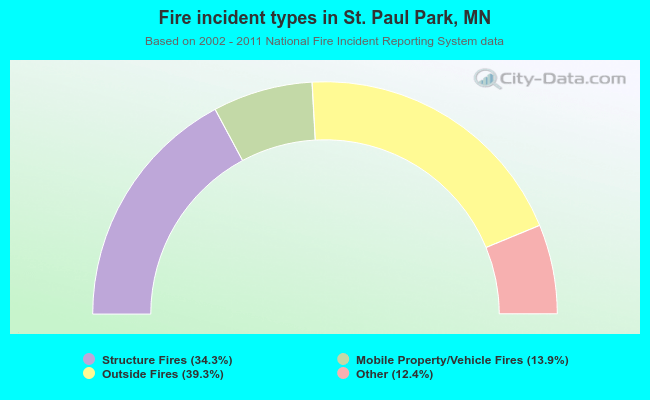 When looking into fire subcategories, the most incidents belonged to: Outside Fires (39.3%), and Structure Fires (34.3%).