Stallings: Fire Incidents, North Carolina (NC)
Where are fire incidents reported in Stallings, NC
Something went wrong! Please refresh the page.
|
| |||||||||||||||||||||||||||||||||||||||||||||||||||||||||||||||||||||||||||||||||||||||||||||||||||||||||||||
2005 - 2018 National Fire Incident Reporting System (NFIRS) incidents
- Incident types reported to NFIRS in Stallings, NC
- 1,71853.6%Rescue & EMS
- 59718.6%Good Intent Call
- 33810.5%False Alarm
- 1926.0%Fire
- 1835.7%Service Call
- 1544.8%Hazardous Condition
- 130.4%Overpressure Rupture
- 90.3%Severe Weather
- 40.1%Special Incident
- Fire incident types reported to NFIRS in Stallings, NC
- 8343.2%Outside Fires
- 7137.0%Structure Fires
- 2714.1%Mobile Property/Vehicle Fires
- 115.7%Other
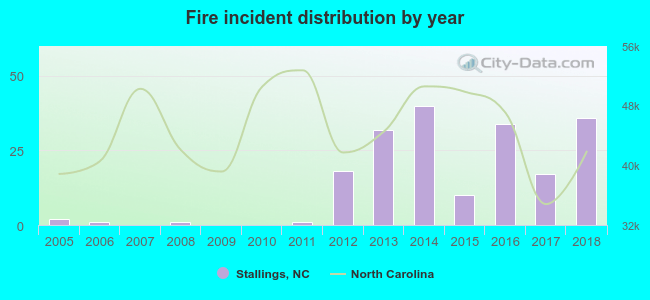 According to the data from the years 2005 - 2018 the average number of fires per year is 14. The highest number of reported fire incidents - 40 took place in 2014, and the least - 0 in 2007. The data has a rising trend.
The average number of yearly fire incidents per 10k residents in Stallings, NC compared to nearest cities:
(Note: Based on data for the last 3 years, including only cities with population 5,000 and above)
| Stallings: | 19.4 |
| Indian Trail: | 24.3 |
| Matthews: | 16.6 |
| Weddington: | 13.6 |
| Wesley Chapel: | 13.4 |
| Mint Hill: | 26.7 |
| Unionville: | 1.6 |
| Marvin: | 8.8 |
| Monroe: | 70.1 |
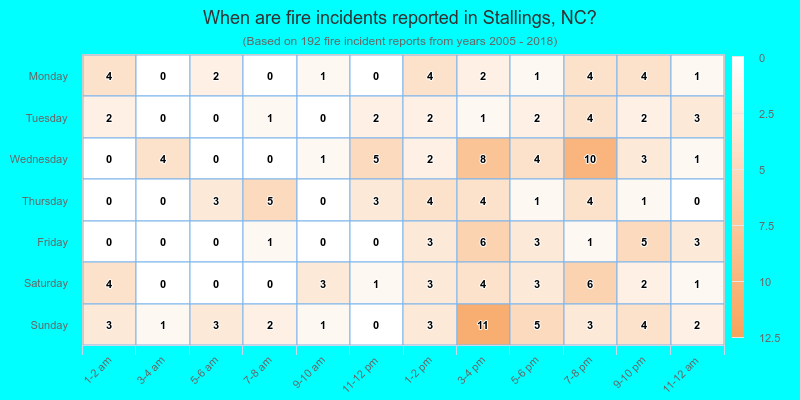
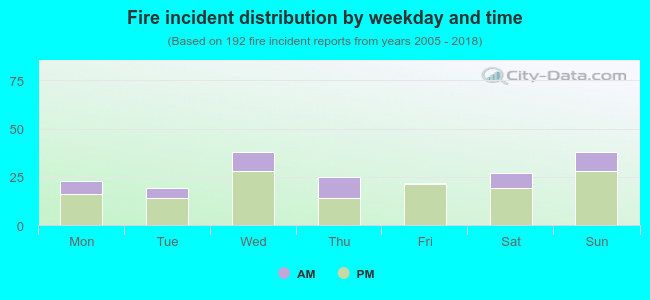 27.1% incidents where reported in the morning and 72.9% in the evening. The most fires (19.8%) took place on Wednesday, and the least (9.9%) on Tuesday.
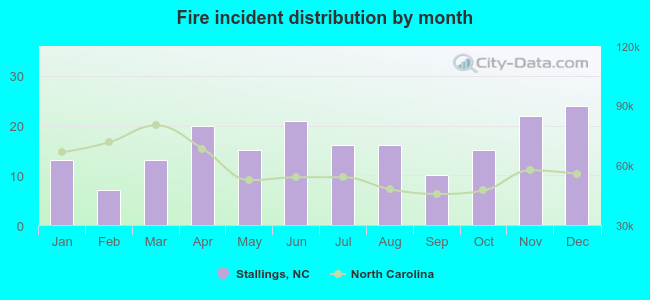 Based on the 192 reports from years 2005 - 2018 most fires (12.5%) took place during December, and the least (3.6%) in February.
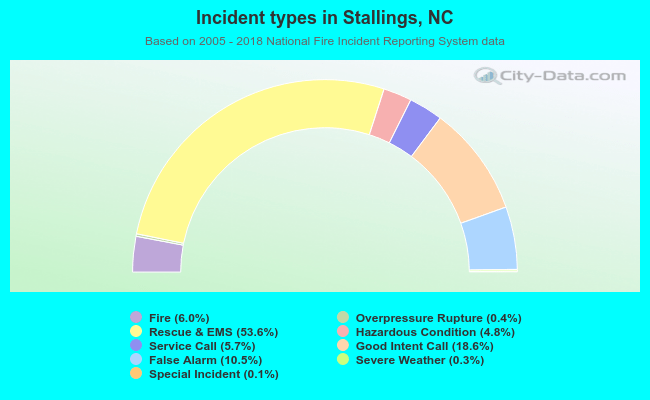 Out of all 3,208 cases reported during the years 2005 - 2018, the most belonged to the categories: Rescue & EMS (53.6%), Good Intent Call (18.6%), and False Alarm (10.5%).
 When looking into fire subcategories, the most reports belonged to: Outside Fires (43.2%), and Structure Fires (37.0%).