Statesboro: Fire Incidents, Georgia (GA)
Where are fire incidents reported in Statesboro, GA
Something went wrong! Please refresh the page.
| Fire incidents reported | |
|---|---|
| Sreet name | Count |
| MAIN ST | 304 |
| LANIER DR | 266 |
| HIGHWAY 301 | 198 |
| NORTHSIDE DR | 138 |
| GEORGIA AVE | 130 |
| HIGHWAY 80 | 120 |
| VETERANS MEMORIAL PKY | 108 |
| CHANDLER RD | 98 |
| HIGHWAY 67 | 98 |
| BURKHALTER RD | 76 |
| COLLEGE ST | 72 |
| FAIR RD | 60 |
| PACKINGHOUSE RD | 60 |
| OLD RIVER RD | 58 |
| STATESBORO PLACE CIR | 58 |
| HIGHWAY 24 | 54 |
| JONES AVE | 50 |
| LANGSTON CHAPEL RD | 48 |
| I16 | 46 |
| OLD REGISTER RD | 46 |
| LAKEVIEW RD | 38 |
| MILLER STREET EXT | 38 |
| HARVILLE RD | 36 |
| GRADY ST | 34 |
| PARRISH ST | 34 |
| CYPRESS LAKE RD | 32 |
| HIGHWAY 46 | 30 |
| JONES MILL RD | 30 |
| OLD REGISTER WAY | 30 |
| ZETTEROWER AVE | 30 |
| Other | 588 |
2007 - 2018 National Fire Incident Reporting System (NFIRS) incidents
- Incident types reported to NFIRS in Statesboro, GA
- 3,00836.1%Fire
- 1,89922.8%False Alarm
- 98611.8%Hazardous Condition
- 93111.2%Good Intent Call
- 7328.8%Service Call
- 7248.7%Rescue & EMS
- 300.4%Overpressure Rupture
- 240.3%Severe Weather
- Fire incident types reported to NFIRS in Statesboro, GA
- 1,31443.7%Outside Fires
- 1,11937.2%Structure Fires
- 53217.7%Mobile Property/Vehicle Fires
- 431.4%Other
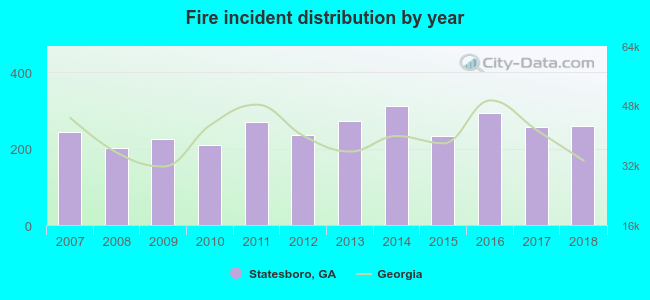 According to the data from the years 2007 - 2018 the average number of fire incidents per year is 251. The highest number of fires - 312 took place in 2014, and the least - 201 in 2008. The data has an increasing trend.
The average number of yearly fire incidents per 10k residents in Statesboro, GA compared to nearest cities:
(Note: Based on data for the last 3 years, including only cities with population 5,000 and above)
| Statesboro: | 88.6 |
| Rincon: | 63.6 |
| Swainsboro: | 191.8 |
| Glennville: | 116.0 |
| Pooler: | 60.2 |
| Port Wentworth: | 85.2 |
| Vidalia: | 35.9 |
| Garden City: | 134.9 |
| Hinesville: | 36.1 |
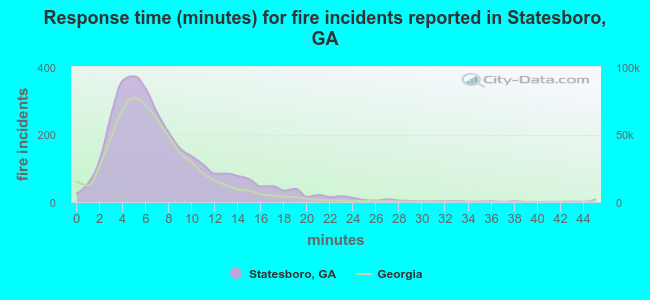 The median response time based on all reported fire incidents is 6 minutes. This is close to the state median value.
The median response time in Statesboro, GA compared to nearest cities:
(Note: Based on data for all years, including only cities with at least 500 fire incidents)
| Statesboro: | 6 minutes |
| Claxton: | 7 minutes |
| Sylvania: | 9 minutes |
| Guyton: | 8 minutes |
| Millen: | 10 minutes |
| Springfield: | 7 minutes |
| Reidsville: | 9 minutes |
| Rincon: | 6 minutes |
| Swainsboro: | 8 minutes |
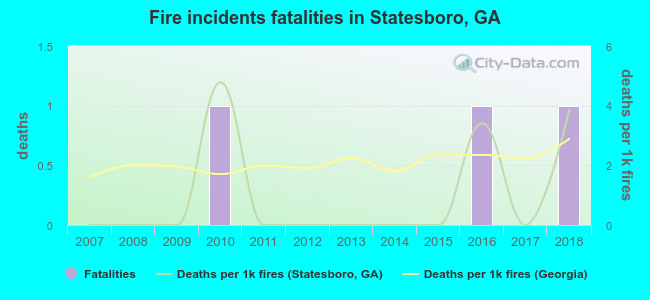 Based on the reports from the years 2007 - 2018 the average number of fire-related yearly deaths is 0. The highest number of deaths - 1 took place in 2010, and the lowest - 0 in 2007. The data has a rising trend.
The average number of deaths per 1,000 fire incidents is 1. This indicator was the highest - 5 in 2010, and the lowest 0 in 2007. The trend for fatalities per 1,000 fires is increasing. Compared to the state value the number of deaths per 1,000 incidents is much lower.
Based on the reports from the years 2007 - 2018 the average number of fire-related yearly deaths is 0. The highest number of deaths - 1 took place in 2010, and the lowest - 0 in 2007. The data has a rising trend.
The average number of deaths per 1,000 fire incidents is 1. This indicator was the highest - 5 in 2010, and the lowest 0 in 2007. The trend for fatalities per 1,000 fires is increasing. Compared to the state value the number of deaths per 1,000 incidents is much lower.Deaths per 1,000 incidents in Statesboro, GA compared to nearest cities:
(Note: Based on data for all years, including only cities with at least 2,500 fire incidents)
| Statesboro: | 1.0 |
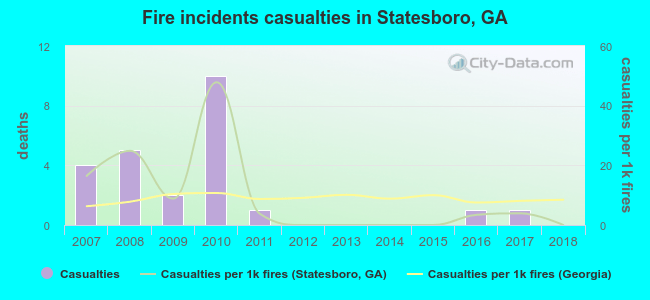 Based on the reports from the years 2007 - 2018 the average number of fire-related yearly casualties is 2. The highest number of casualties - 10 took place in 2010, and the lowest - 0 in 2012. The data has a dropping trend.
The average number of casualties per 1,000 fire incidents is 9. This indicator was the highest - 48 in 2010, and the lowest 0 in 2012. The trend for casualties per 1,000 incidents is decreasing. Compared to the state value the number of casualties per 1,000 incidents is similar.
Based on the reports from the years 2007 - 2018 the average number of fire-related yearly casualties is 2. The highest number of casualties - 10 took place in 2010, and the lowest - 0 in 2012. The data has a dropping trend.
The average number of casualties per 1,000 fire incidents is 9. This indicator was the highest - 48 in 2010, and the lowest 0 in 2012. The trend for casualties per 1,000 incidents is decreasing. Compared to the state value the number of casualties per 1,000 incidents is similar.Casualties per 1,000 incidents in Statesboro, GA compared to nearest cities:
(Note: Based on data for all years, including only cities with at least 500 fire incidents)
| Statesboro: | 8.0 |
| Claxton: | 6.5 |
| Sylvania: | 2.3 |
| Guyton: | 4.5 |
| Millen: | 3.5 |
| Springfield: | 3.5 |
| Reidsville: | 0.0 |
| Rincon: | 5.9 |
| Swainsboro: | 0.0 |
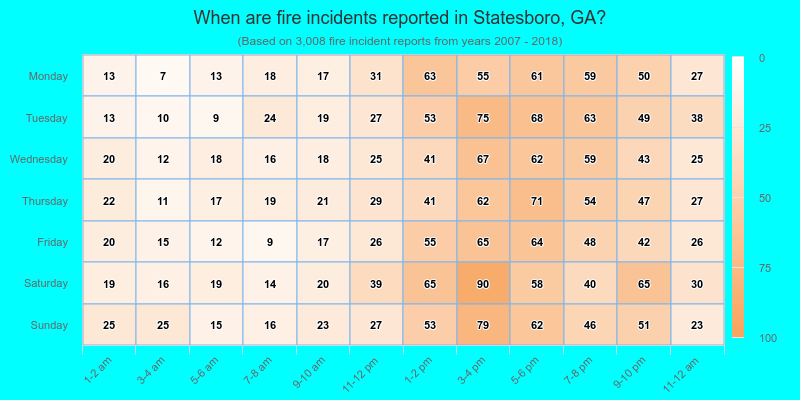
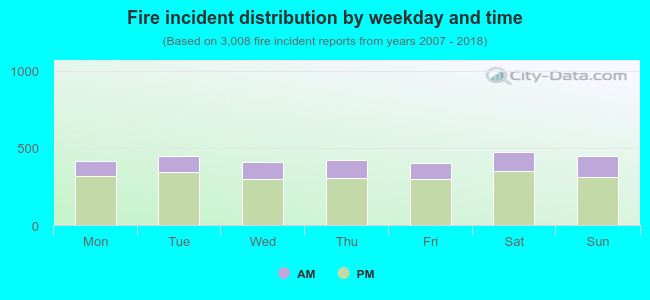 26.1% incidents where reported in the morning and 73.9% in the evening. The most fires (15.8%) took place on Saturday, and the least (13.3%) on Friday.
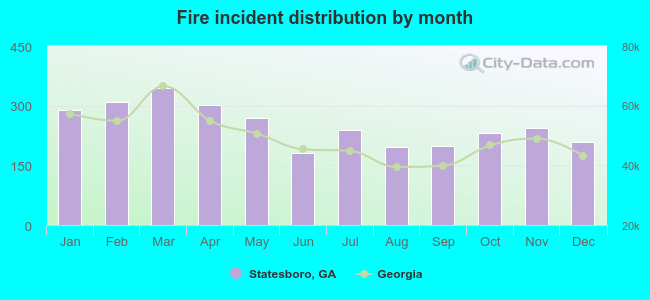 Based on the 3,008 fires from years 2007 - 2018 most fires (11.4%) took place during March, and the least (6.0%) in June.
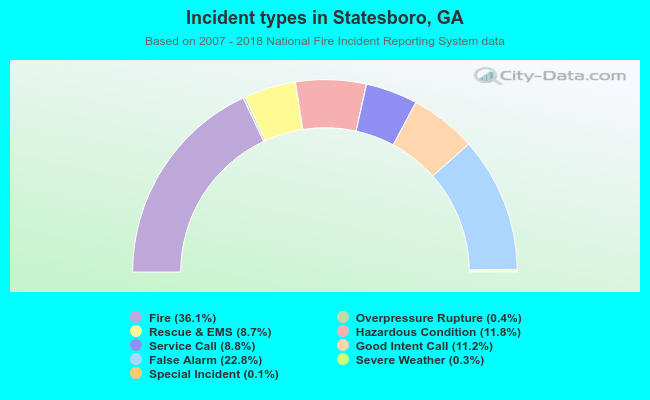 Out of all 8,341 cases reported during the years 2007 - 2018, the most belonged to the categories: Fire (36.1%), False Alarm (22.8%), and Hazardous Condition (11.8%).
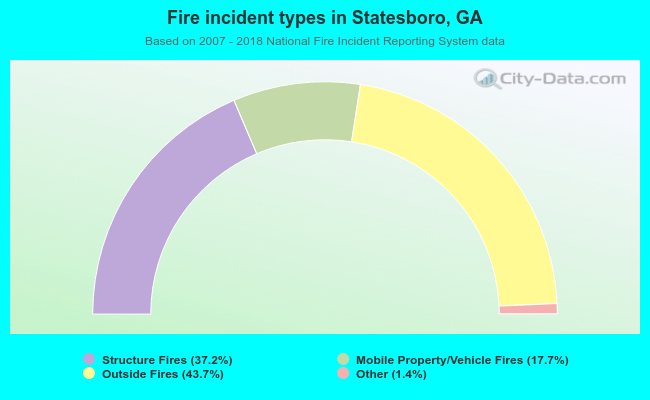 When looking into fire subcategories, the most reports belonged to: Outside Fires (43.7%), and Structure Fires (37.2%).