| Fire incidents reported |
|---|
| Sreet name | Count |
|---|
| SHORELINE HWY | 32 | | BUENA VISTA | 12 | | CALLE DEL MAR | 12 | | SHORELINE HWY | 12 | | SEADRIFT RD | 10 | | SEADRIFT RD | 8 | | BELVEDERE | 6 | | DIPSEA RD | 6 | | HIGHWAY ONE | 6 | | PANORAMIC HWY | 6 | | SHORELINE | 6 | | SHORELINE HW | 6 | | CALLE DEL ONDA | 4 | | CALLE DEL RIBERA | 4 | | DIPSEA RD | 4 | | HIGHWAY ONE HWY | 4 | | PANORAMIC | 4 | | PANORAMIC HWY | 4 | | SHORELLINE HWY | 4 | | WILLOW | 4 | | 303 SEADRIFT ROAD | 2 | | ALAMEDA PATIO | 2 | | ARENAL | 2 | | ARENAL AV | 2 | | ARENAL AVE | 2 |
| | | Fire incidents reported |
|---|
| Sreet name | Count |
|---|
| AVENIDA LAS BAULINES | 2 | | BELVEDERE AVE | 2 | | BUEAN VISTA | 2 | | CALLE DEL ARROYO | 2 | | CALLE DEL ARROYO AT CALLE DEL | 2 | | CALLE DEL OCCIDENTE/BEACH | 2 | | CALLE DEL PRADERO | 2 | | CALLE DEL SIERRA RD | 2 | | CALLED DEL MAR | 2 | | CENTRAL LOT NAT'L PK | 2 | | CRN BELVEDERE/LINCOLN | 2 | | DIPSEA RD. | 2 | | END OF SEADRIFT RD ON BEACH | 2 | | FAIRFAX-BOLINAS RD | 2 | | HWY ONE MM14.37 | 2 | | JOAQUIN PATIO | 2 | | LAUREL AVE | 2 | | MARINE | 2 | | MARINE WAY | 2 | | MESA RD | 2 | | MM 1095 | 2 | | MM65 ON OLEMABOLINAS RD | 2 | | ON BEACH CALLE DEL SIERRA | 2 | | PAN TOLL RD | 2 | | |
|
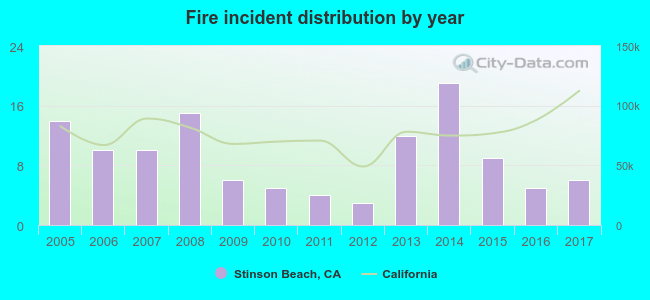 According to the data from the years 2005 - 2017 the average number of fires per year is 9. The highest number of fires - 19 took place in 2014, and the least - 3 in 2012. The data has a dropping trend.
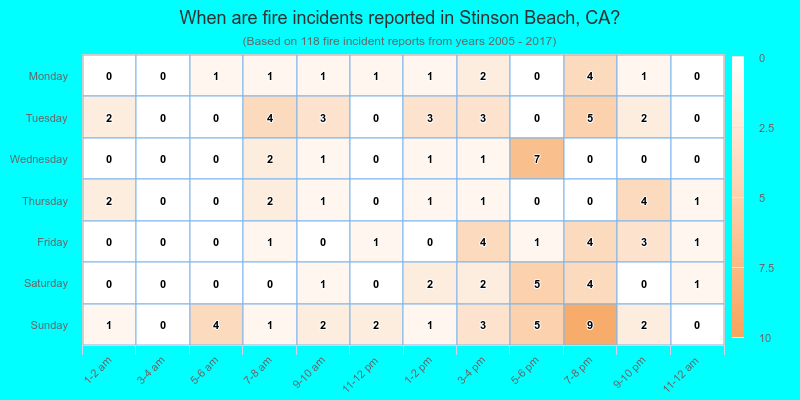
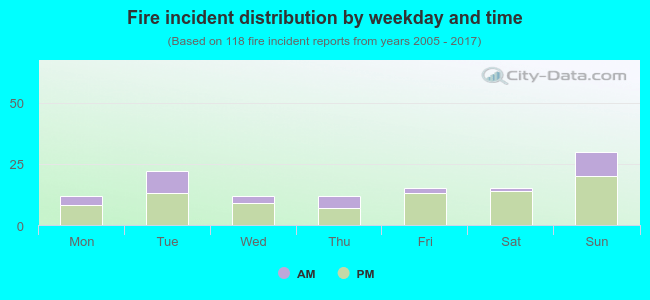 28.8% incidents where reported in the morning and 71.2% in the evening. The most fires (25.4%) took place on Sunday, and the least (10.2%) on Monday.
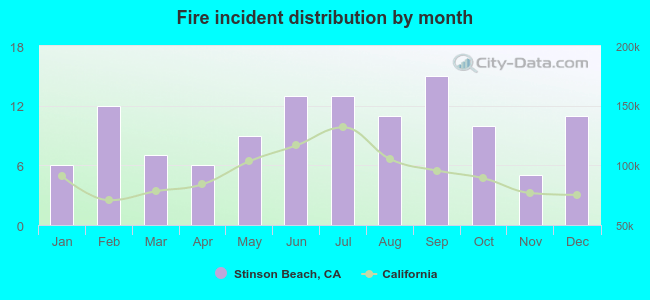 According to the 118 fire incidents from years 2005 - 2017 most fires (12.7%) took place during September, and the least (4.2%) in November.
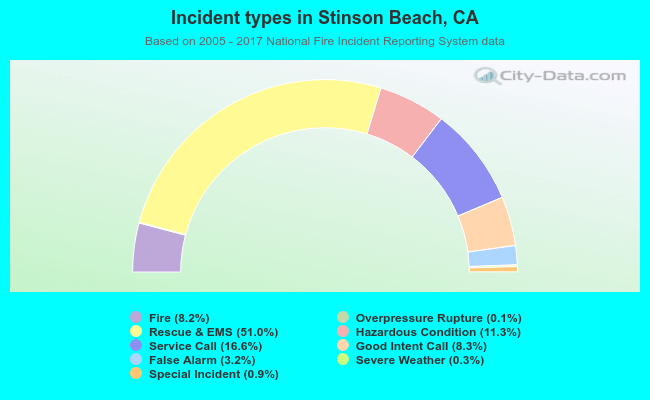 Out of all 1,436 cases reported during the years 2005 - 2017, the most belonged to the categories: Rescue & EMS (51.0%), Service Call (16.6%), and Hazardous Condition (11.3%).
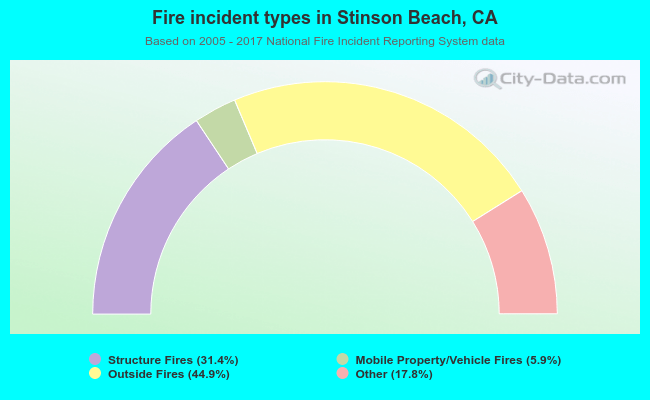 When looking into fire subcategories, the most incidents belonged to: Outside Fires (44.9%), and Structure Fires (31.4%).