Stuart: Fire Incidents, Florida (FL)
Where are fire incidents reported in Stuart, FL
Something went wrong! Please refresh the page.
| Fire incidents reported | |
|---|---|
| Sreet name | Count |
| FEDERAL | 340 |
| OCEAN BLVD | 164 |
| FEDERAL HWY | 162 |
| KANNER | 88 |
| DIXIE | 78 |
| I-95 | 64 |
| I95 | 64 |
| GATEHOUSE CIR | 52 |
| MONTEREY RD | 52 |
| TURNPIKE | 50 |
| COVE | 48 |
| DIXIE HWY | 40 |
| SALERNO | 40 |
| ST. LUCIE BLVD | 38 |
| FLAGLER AVE | 36 |
| INDIAN ST | 36 |
| COMMERCE AVE | 32 |
| KANNER HWY | 32 |
| PRATT WHITNEY | 32 |
| MONTEREY | 30 |
| ST LUCIE BLVD | 30 |
| COLORADO AVE | 28 |
| ISABELITA AVE | 26 |
| TARPON AVE | 26 |
| PALM BEACH | 22 |
| PALM BEACH RD | 22 |
| WILLOUGHBY BLVD | 22 |
| 14TH ST | 20 |
| ASTER LANE | 20 |
| FORK | 20 |
| Other | 321 |
2002 - 2018 National Fire Incident Reporting System (NFIRS) incidents
- Incident types reported to NFIRS in Stuart, FL
- 34,85877.8%Rescue & EMS
- 2,6315.9%Good Intent Call
- 2,0354.5%Fire
- 2,0304.5%False Alarm
- 1,9594.4%Hazardous Condition
- 1,2652.8%Service Call
- Fire incident types reported to NFIRS in Stuart, FL
- 1,03550.9%Outside Fires
- 52825.9%Structure Fires
- 42721.0%Mobile Property/Vehicle Fires
- 452.2%Other
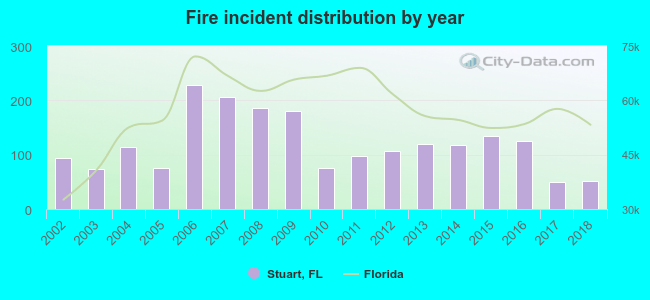 Based on the data from the years 2002 - 2018 the average number of fires per year is 120. The highest number of fires - 229 took place in 2006, and the least - 50 in 2017. The data has a decreasing trend.
The average number of yearly fire incidents per 10k residents in Stuart, FL compared to nearest cities:
(Note: Based on data for the last 3 years, including only cities with population 5,000 and above)
| Stuart: | 46.7 |
| Palm City: | 21.5 |
| Jensen Beach: | 27.0 |
| Port Salerno: | 1.0 |
| Hobe Sound: | 18.7 |
| Fort Pierce: | 123.2 |
| Indiantown: | 54.2 |
| Tequesta: | 21.0 |
| Jupiter: | 3.0 |
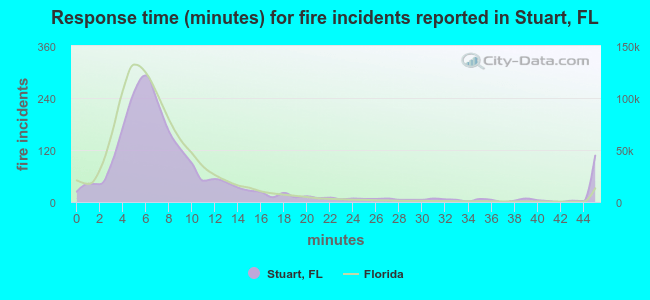 The median response time based on all reported fire incidents is 7 minutes. This is about the same as the state median value.
The median response time in Stuart, FL compared to nearest cities:
(Note: Based on data for all years, including only cities with at least 500 fire incidents)
| Stuart: | 7 minutes |
| Palm City: | 11 minutes |
| Jensen Beach: | 8 minutes |
| Fort Pierce: | 9 minutes |
| Jupiter: | 7 minutes |
| Palm Beach Gardens: | 6 minutes |
| North Palm Beach: | 5 minutes |
| Riviera Beach: | 5 minutes |
| Vero Beach: | 8 minutes |
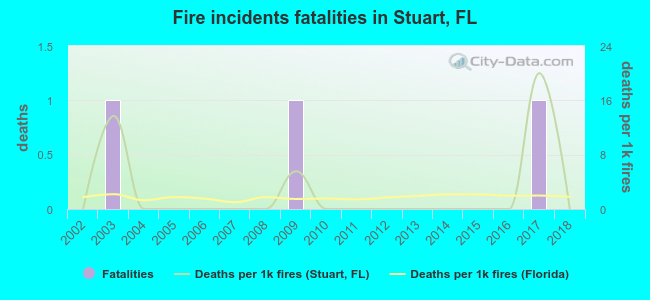 According to the data from the years 2002 - 2018 the average number of fire-related yearly deaths is 0. The highest number of deaths - 1 took place in 2003, and the lowest - 0 in 2002. The data has a constant trend.
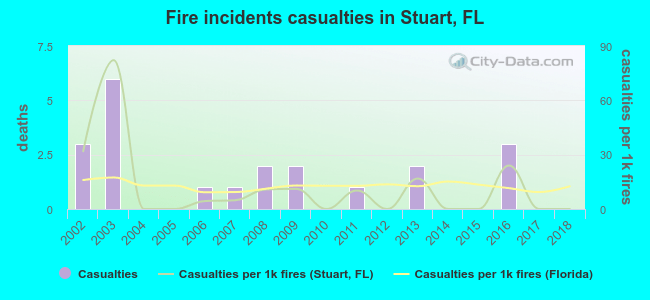 Based on the reports from the years 2002 - 2018 the average number of fire-related casualties per year is 1. The highest number of casualties - 6 took place in 2003, and the lowest - 0 in 2004. The data has a dropping trend.
The average number of injuries per 1,000 fires is 12. This indicator was the highest - 82 in 2003, and the lowest 0 in 2004. The trend for casualties per 1,000 incidents is declining. Compared to the Florida value the number of casualties per 1,000 fires is lower.
Based on the reports from the years 2002 - 2018 the average number of fire-related casualties per year is 1. The highest number of casualties - 6 took place in 2003, and the lowest - 0 in 2004. The data has a dropping trend.
The average number of injuries per 1,000 fires is 12. This indicator was the highest - 82 in 2003, and the lowest 0 in 2004. The trend for casualties per 1,000 incidents is declining. Compared to the Florida value the number of casualties per 1,000 fires is lower.Casualties per 1,000 incidents in Stuart, FL compared to nearest cities:
(Note: Based on data for all years, including only cities with at least 500 fire incidents)
| Stuart: | 10.3 |
| Palm City: | 11.7 |
| Jensen Beach: | 9.0 |
| Fort Pierce: | 2.6 |
| Jupiter: | 23.9 |
| Palm Beach Gardens: | 4.4 |
| North Palm Beach: | 33.8 |
| Riviera Beach: | 50.2 |
| Vero Beach: | 2.2 |
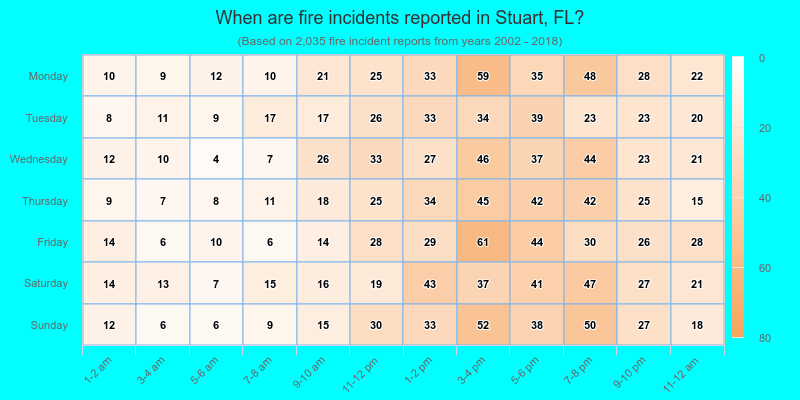
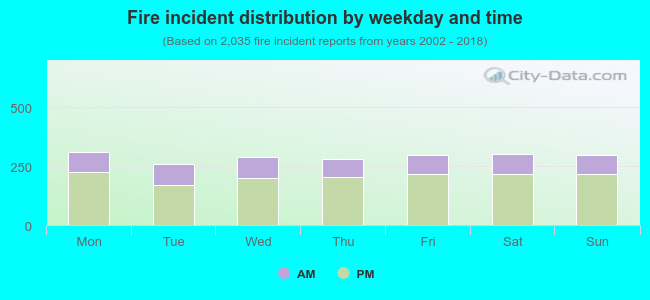 28.7% incidents where reported in the morning and 71.3% in the evening. The most fires (15.3%) took place on Monday, and the least (12.8%) on Tuesday.
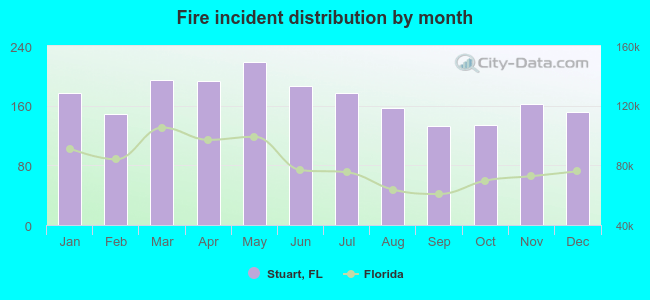 Based on the 2,035 incident reports from years 2002 - 2018 most fires (10.8%) took place during May, and the least (6.5%) in September.
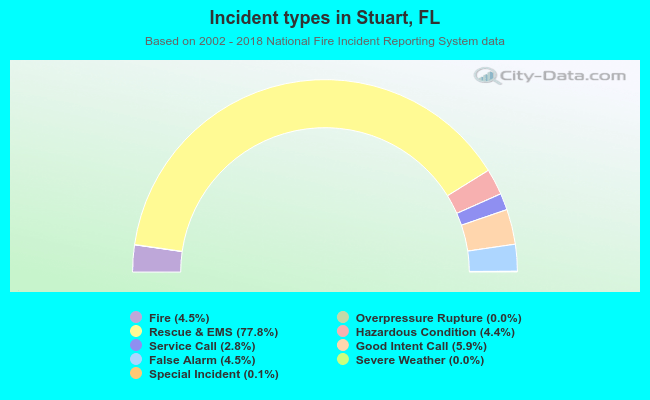 Out of all 44,832 cases reported during the years 2002 - 2018, the most belonged to the categories: Rescue & EMS (77.8%), Good Intent Call (5.9%), and Fire (4.5%).
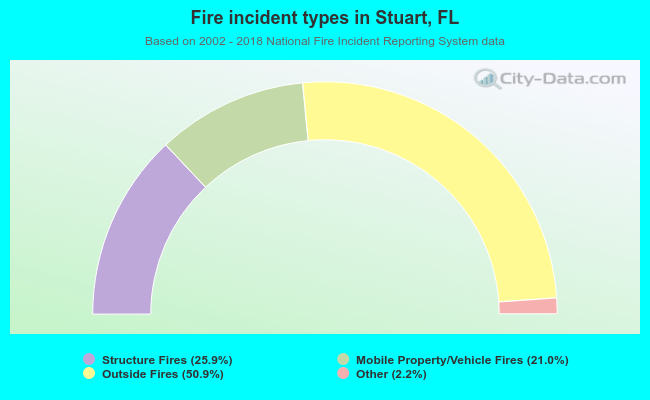 When looking into fire subcategories, the most incidents belonged to: Outside Fires (50.9%), and Structure Fires (25.9%).