| Fire incidents reported |
|---|
| Sreet name | Count |
|---|
| 11W HWY | 20 | | MAIN ST | 20 | | 940 PHIPPS BEND RD | 14 | | HIGHWAY 11W | 14 | | CARTERS VALLEY ROAD | 12 | | MAIN STREET | 12 | | STANLEY VALLEY RD | 12 | | HIGHWAY 11-W | 8 | | HWY 11W | 8 | | MAIN ST | 8 | | PHIPPS BEND RD | 8 | | ZION HILL RD | 8 | | 251 ANDERSON RD | 6 | | 600 AFG ROAD | 6 | | 803 CHURCH ST | 6 | | BYINGTON RD | 6 | | CANEY VALLEY LOOP | 6 | | CANEY VALLEY LOOP | 6 | | EAST MAIN STREET | 6 | | FOREST VIEW DR | 6 | | LONG HOLLOW ROAD | 6 | | LONGS BEND ROAD | 6 | | PHIPPS BEND RD | 6 | | PHIPPS BEND ROAD | 6 | | PRICES RD | 6 |
| | | Fire incidents reported |
|---|
| Sreet name | Count |
|---|
| SHANKS GAP ROAD | 6 | | STONY POINT RD | 6 | | WILLIAMS ROAD | 6 | | 1015 MAIN ST | 4 | | 118 PINE ST | 4 | | 1741 CANEY VALLEY LOOP | 4 | | 235 PRICES ROAD | 4 | | 2538 STANLEY VALLEY ROAD | 4 | | 3049 HWY 11W LGTS | 4 | | 350 RED HILL | 4 | | 921 PHIPPS BEND RD | 4 | | BRAY ROAD | 4 | | BYINGTON ROAD | 4 | | CHEROKEE ST | 4 | | CHURCH AVE | 4 | | CROSS VALLEY RD | 4 | | CROSS VALLEY RD | 4 | | ELM STREET | 4 | | FERRY RD | 4 | | GATEWOOD RD | 4 | | GRAVELY VALLEY RD | 4 | | HOUSEWRIGHT HOLLOW | 4 | | HOUSEWRIGHT HOLLOW RD | 4 | | HWY 11-W | 4 | | HWY 11W LGTS | 4 |
|
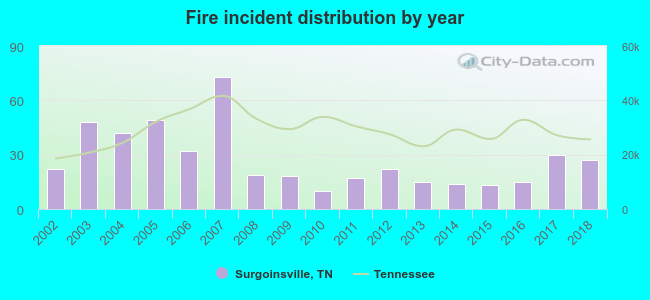 Based on the data from the years 2002 - 2018 the average number of fires per year is 27. The highest number of fires - 73 took place in 2007, and the least - 10 in 2010. The data has an increasing trend.
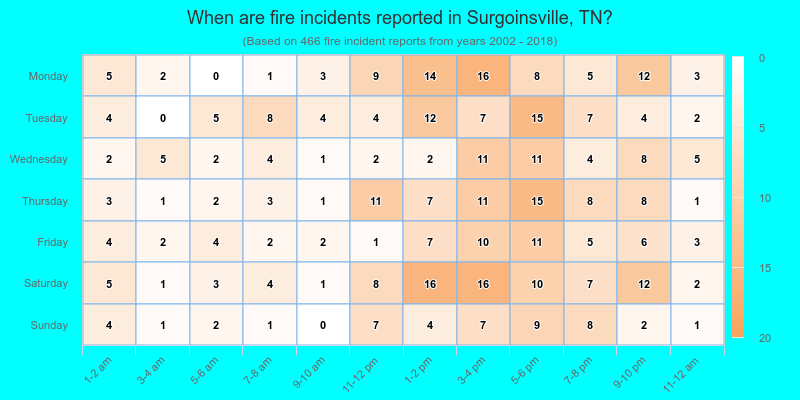
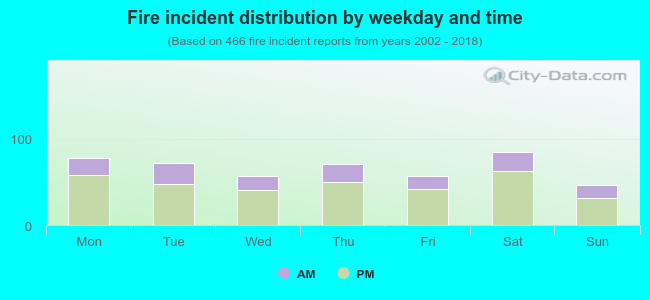 28.8% incidents where reported in the morning and 71.2% in the evening. The most fires (18.2%) took place on Saturday, and the least (9.9%) on Sunday.
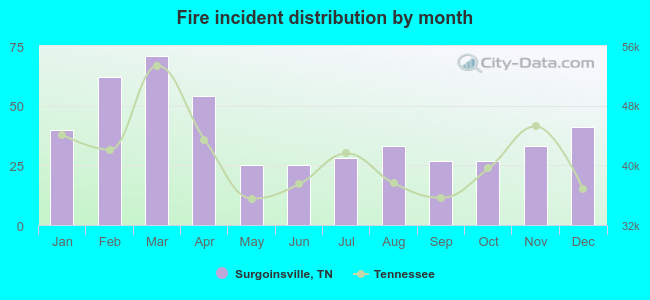 According to the 466 reports from years 2002 - 2018 most fires (15.2%) took place during March, and the least (5.4%) in May.
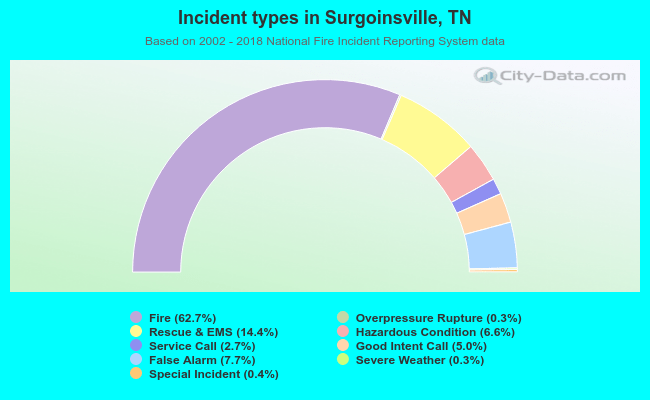 Out of all 743 cases reported during the years 2002 - 2018, the most belonged to the categories: Fire (62.7%), Rescue & EMS (14.4%), and False Alarm (7.7%).
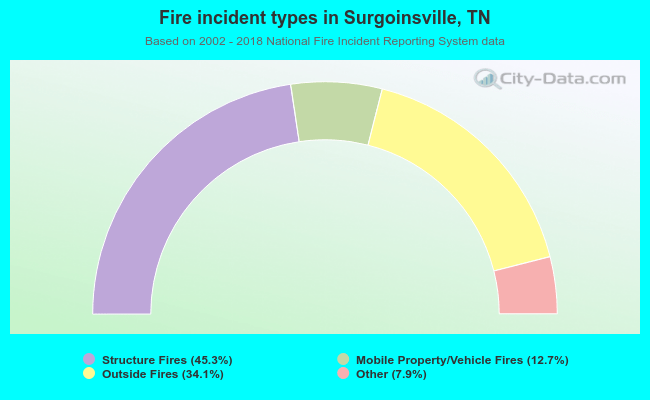 When looking into fire subcategories, the most incidents belonged to: Structure Fires (45.3%), and Outside Fires (34.1%).