| Fire incidents reported |
|---|
| Sreet name | Count |
|---|
| GRAPEVINE TRAIL | 8 | | MOBILE ROAD | 8 | | TAMMS OLIVE BRANCH RD | 8 | | WEST ST | 8 | | 127 HWY | 6 | | 3RD STREET | 6 | | CAIRO AVE | 6 | | OLD ELCO RD | 6 | | OLD ELCO ROAD | 6 | | RAILROAD ST | 6 | | 105 2ND STRE | 4 | | 127 | 4 | | 3RD ST | 4 | | 510 ROUTE 127 | 4 | | H.W. 127 | 4 | | INDIANA ST | 4 | | MAIN ST | 4 | | NEWELL RD | 4 | | OLD DELTA ROAD | 4 | | TAMMAS - OLIVE BRANCH RD. | 4 | | TAMMS OLIVE BRANCH RD | 4 | | TAMMS OLIVE BRANCH BLACKTOP | 4 | | TAMMS RD | 4 | | ULLIN RD | 4 | | 100 MCKINLEY ST | 2 |
| | | Fire incidents reported |
|---|
| Sreet name | Count |
|---|
| 105 2ND ST ST | 2 | | 105 SECOND ST. | 2 | | 115 CENTER STREET | 2 | | 115 CENTER STREET | 2 | | 127& CLANK ROAD | 2 | | 155 S RAILROAD | 2 | | 16598 NEWELL RD | 2 | | 16758 NEWELL ROAD | 2 | | 17155 CLANK ROAD | 2 | | 17355 MOBILE ROAD | 2 | | 17537 UNITY ROAD | 2 | | 190 IDEAL WILD STREET | 2 | | 19866 CLANK ROAD | 2 | | 19866CLANK ROAD | 2 | | 21410 WEST JACKSON STREET | 2 | | 21638 ROUTE 127 | 2 | | 23151 ROUTE 127 | 2 | | 23151 STATE HIGHWAY 127 | 2 | | 25701 OAK STREET | 2 | | 25741 OAK ST | 2 | | 25835 ELM STREET | 2 | | 26164 STATE HIGHWAY 127 HWY | 2 | | 26164 STATE HWY 127 | 2 | | 27171 TAMMSOLIVE BRANCH ROAD | 2 | | |
|
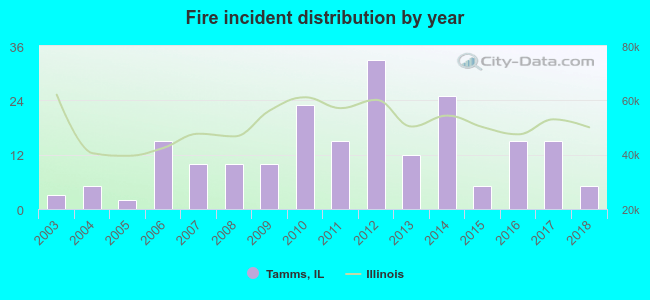 According to the data from the years 2003 - 2018 the average number of fire incidents per year is 13. The highest number of fires - 33 took place in 2012, and the least - 2 in 2005. The data has a rising trend.
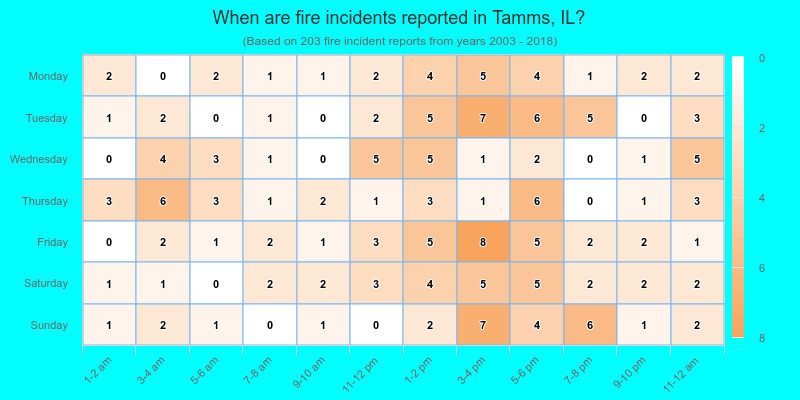
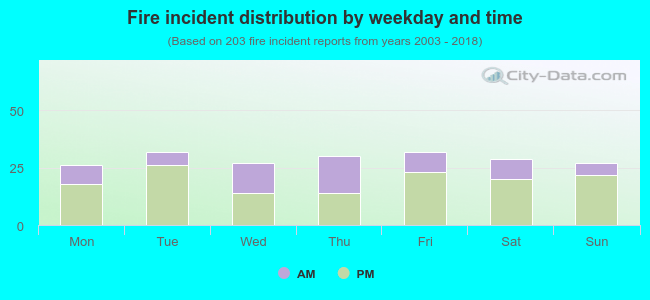 32.5% incidents where reported in the morning and 67.5% in the evening. The most fires (15.8%) took place on Tuesday, and the least (12.8%) on Monday.
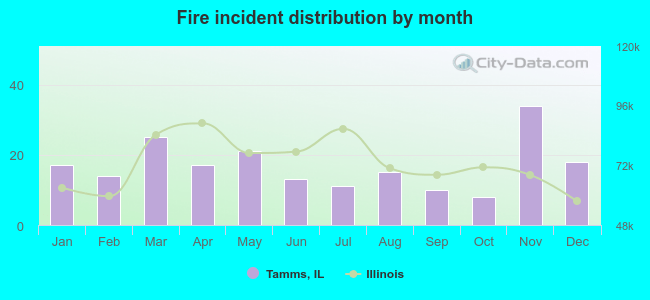 According to the 203 fires from years 2003 - 2018 most fires (16.7%) took place during November, and the least (3.9%) in October.
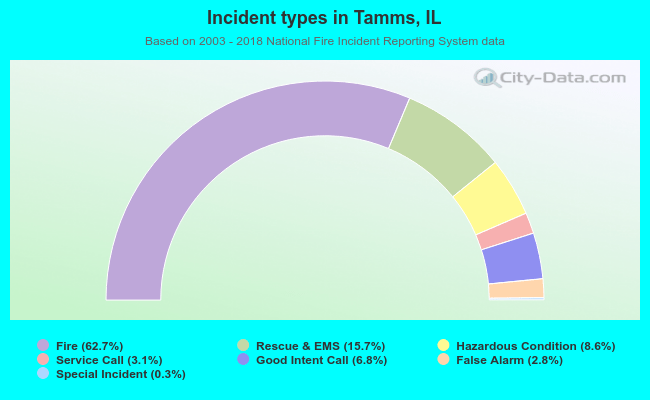 Out of all 324 cases reported during the years 2003 - 2018, the most belonged to the categories: Fire (62.7%), Overpressure Rupture (15.7%), and Rescue & EMS (8.6%).
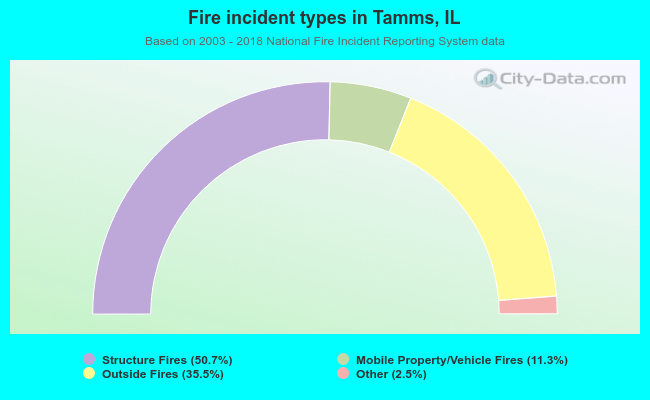 When looking into fire subcategories, the most incidents belonged to: Structure Fires (50.7%), and Outside Fires (35.5%).