Tappahannock: Fire Incidents, Virginia (VA)
Where are fire incidents reported in Tappahannock, VA
Something went wrong! Please refresh the page.
|
| |||||||||||||||||||||||||||||||||||||||||||||||||||||||||||||||||||||||||||||||||||||||||||||||||||||||||||||
2004 - 2018 National Fire Incident Reporting System (NFIRS) incidents
- Incident types reported to NFIRS in Tappahannock, VA
- 36137.2%Fire
- 18819.4%Rescue & EMS
- 16817.3%Hazardous Condition
- 12412.8%Good Intent Call
- 808.2%False Alarm
- 313.2%Service Call
- 101.0%Severe Weather
- 70.7%Overpressure Rupture
- 10.1%Special Incident
- Fire incident types reported to NFIRS in Tappahannock, VA
- 16445.4%Structure Fires
- 10529.1%Outside Fires
- 7219.9%Mobile Property/Vehicle Fires
- 205.5%Other
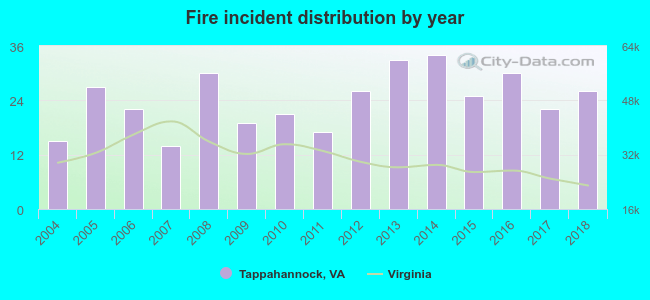 According to the data from the years 2004 - 2018 the average number of fire incidents per year is 24. The highest number of fires - 34 took place in 2014, and the least - 14 in 2007. The data has a growing trend.
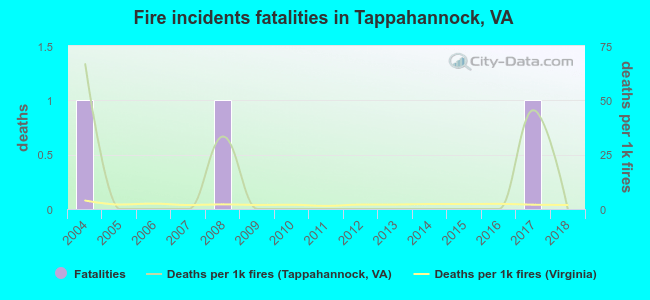 According to the data from the years 2004 - 2018 the average number of fire-related fatalities per year is 0. The highest number of reported deaths - 1 took place in 2004, and the lowest - 0 in 2005. The data has a dropping trend.
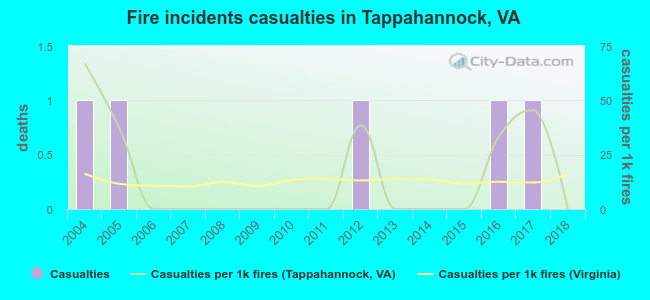 According to the data from the years 2004 - 2018 the average number of fire-related yearly casualties is 0. The highest number of injuries - 1 took place in 2004, and the lowest - 0 in 2006. The data has a decreasing trend.
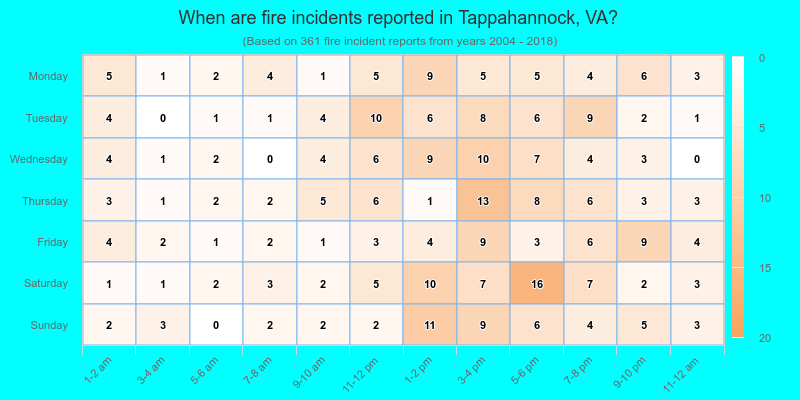
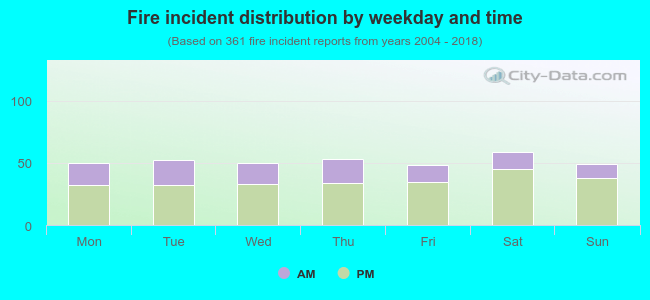 31.0% incidents where reported in the morning and 69.0% in the evening. The most fires (16.3%) took place on Saturday, and the least (13.3%) on Friday.
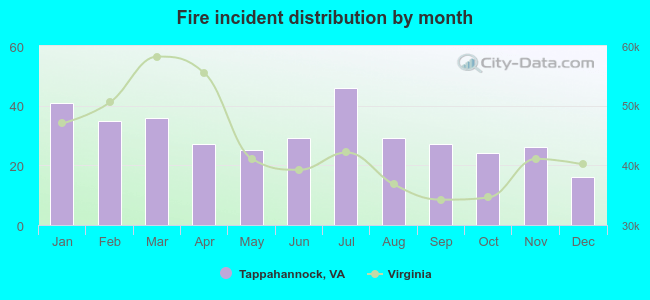 According to the 361 incident reports from years 2004 - 2018 most fires (12.7%) took place during July, and the least (4.4%) in December.
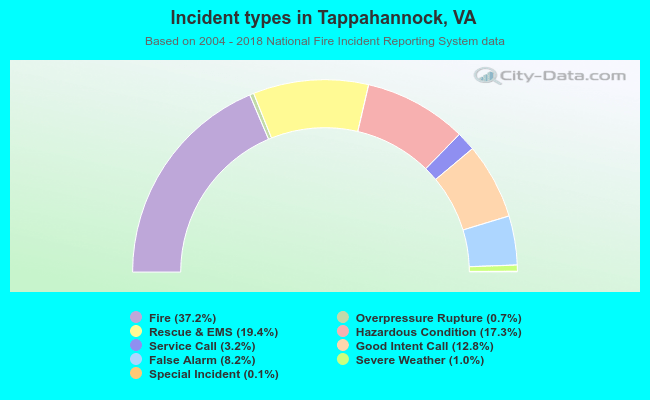 Out of all 970 cases reported during the years 2004 - 2018, the most belonged to the categories: Fire (37.2%), Rescue & EMS (19.4%), and Hazardous Condition (17.3%).
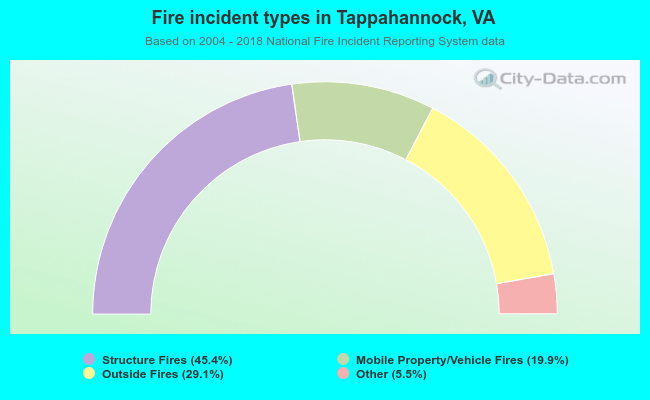 When looking into fire subcategories, the most reports belonged to: Structure Fires (45.4%), and Outside Fires (29.1%).