| Fire incidents reported |
|---|
| Sreet name | Count |
|---|
| CHICKENFOOT RD | 16 | | NC 87 HWY | 16 | | NC HIGHWAY 87 | 16 | | TAR HEEL RD | 10 | | HWY 20 | 8 | | HWY 87 HWY | 8 | | MAYSVILLE LANE | 8 | | MAYSVILLE LN | 8 | | NC HWY 87 | 8 | | CHICKEN FOOT RD | 6 | | CHICKENFOOT RD | 6 | | CHICKENFOOT ROAD | 6 | | HWY 87 | 6 | | MARSH RD | 6 | | NC 87 | 6 | | NC HWY 20 | 6 | | NC131 | 6 | | PURDIE CHURCH RD | 6 | | RED OAK FARM RD | 6 | | 15855 HWY 87 | 4 | | 2152 TAR HEEL FERRY RD | 4 | | 269 TAR HEEL FERRY RD | 4 | | 533 CHICKENFOOT RD | 4 | | BLADEN UNION CHURCH RD | 4 | | BURNEY RD | 4 |
| | | Fire incidents reported |
|---|
| Sreet name | Count |
|---|
| BURNEY ROAD | 4 | | MAIN ST | 4 | | MAIN STREET | 4 | | NC 131 HWY | 4 | | NC HWY 131 | 4 | | OWEN HILL RD | 4 | | RIVER ROAD | 4 | | SPRING BRANCH RD | 4 | | TAR HEEL FERRY RD | 4 | | TAR HEEL FERRY ROAD | 4 | | TOBEMOREY RD | 4 | | 100 RED OAK FARM RD | 2 | | 105 MAYSVILLE LN | 2 | | 10958 NC 87W | 2 | | 1103 CHICKENFOOT RD | 2 | | 11567 NC 87 | 2 | | 11567 NC 87 HWY W | 2 | | 12298 HWY 87 | 2 | | 13441 HWY 87 | 2 | | 13441 HWY 87 W | 2 | | 137 MCALLASTER AND W CIRCLE | 2 | | 14661 NC 87W | 2 | | 148 ROGER DRIVE | 2 | | 1585 GRIMES SINGLETARY RD | 2 | | |
|
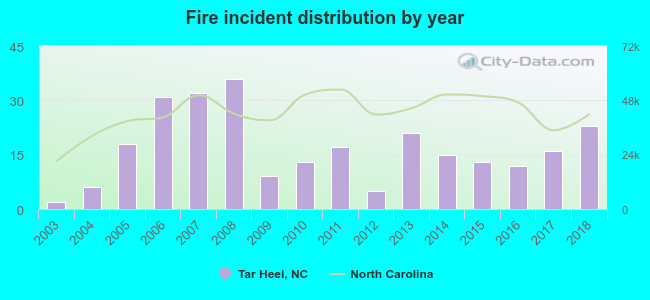 According to the data from the years 2003 - 2018 the average number of fires per year is 17. The highest number of reported fires - 36 took place in 2008, and the least - 2 in 2003. The data has an increasing trend.
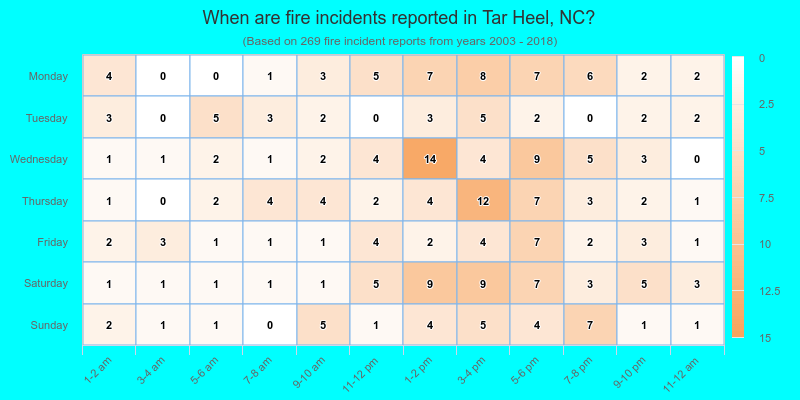
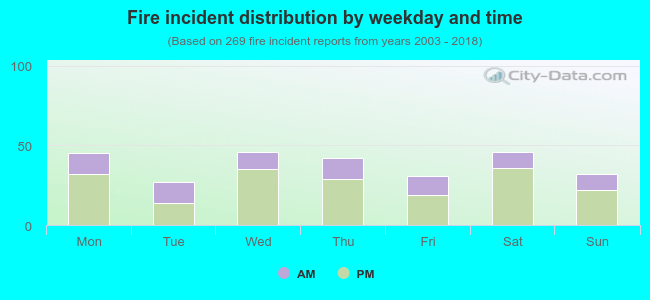 30.5% incidents where reported in the morning and 69.5% in the evening. The most fires (17.1%) took place on Wednesday, and the least (10.0%) on Tuesday.
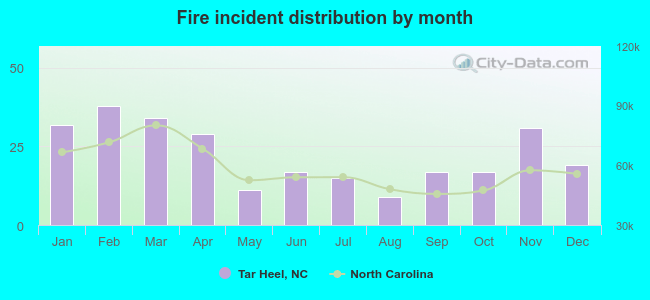 Based on the 269 incident reports from years 2003 - 2018 most fires (14.1%) took place during February, and the least (3.3%) in August.
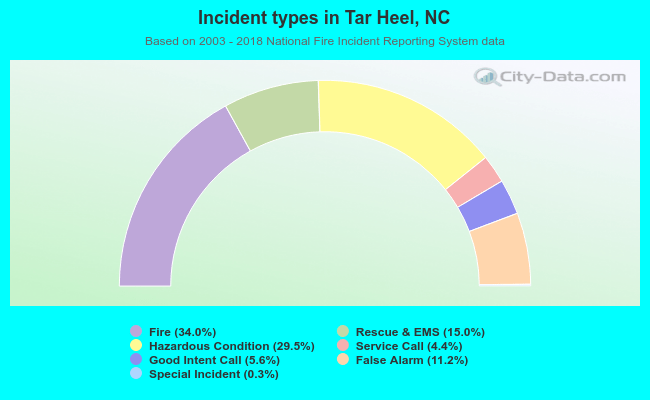 Out of all 792 cases reported during the years 2003 - 2018, the most belonged to the categories: Fire (34.0%), Rescue & EMS (29.5%), and Overpressure Rupture (15.0%).
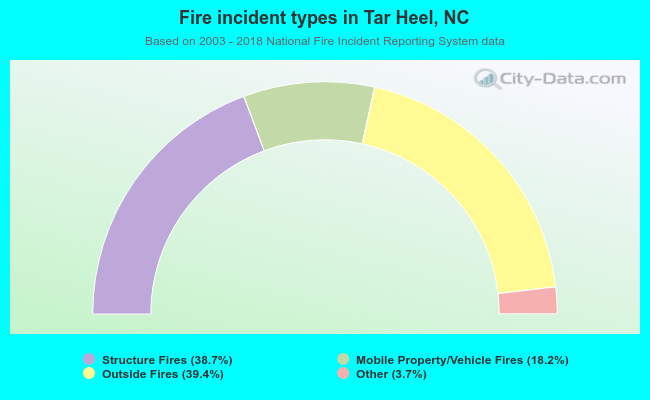 When looking into fire subcategories, the most incidents belonged to: Outside Fires (39.4%), and Structure Fires (38.7%).