Tarrytown: Fire Incidents, New York (NY)
Where are fire incidents reported in Tarrytown, NY
Something went wrong! Please refresh the page.
|
| |||||||||||||||||||||||||||||||||||||||||||||||||||||||||||||||||||||||||||||||||||||||||||||||||||||||||||||
2002 - 2018 National Fire Incident Reporting System (NFIRS) incidents
- Incident types reported to NFIRS in Tarrytown, NY
- 65036.8%False Alarm
- 48727.5%Hazardous Condition
- 27215.4%Fire
- 1347.6%Service Call
- 1307.4%Rescue & EMS
- 754.2%Good Intent Call
- 160.9%Overpressure Rupture
- 40.2%Special Incident
- Fire incident types reported to NFIRS in Tarrytown, NY
- 17865.4%Structure Fires
- 3814.0%Mobile Property/Vehicle Fires
- 3814.0%Outside Fires
- 186.6%Other
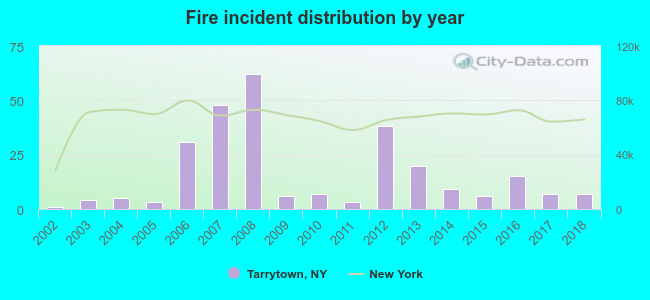 According to the data from the years 2002 - 2018 the average number of fires per year is 16. The highest number of reported fire incidents - 62 took place in 2008, and the least - 1 in 2002. The data has an increasing trend.
The average number of yearly fire incidents per 10k residents in Tarrytown, NY compared to nearest cities:
(Note: Based on data for the last 3 years, including only cities with population 5,000 and above)
| Tarrytown: | 8.4 |
| Sleepy Hollow: | 3.3 |
| Irvington: | 18.2 |
| Greenburgh: | 6.7 |
| Nyack: | 3.8 |
| Dobbs Ferry: | 33.6 |
| Hartsdale: | 102.7 |
| Blauvelt: | 24.6 |
| Briarcliff Manor: | 10.4 |
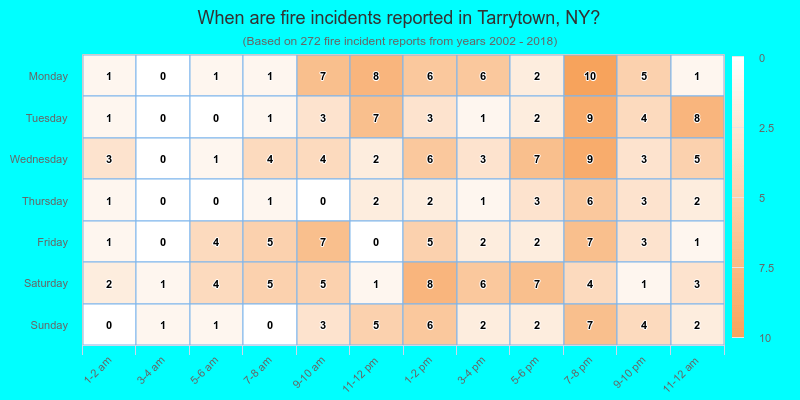
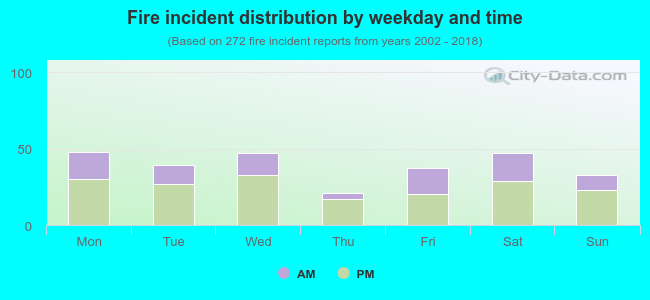 34.2% incidents where reported in the morning and 65.8% in the evening. The most fires (17.6%) took place on Monday, and the least (7.7%) on Thursday.
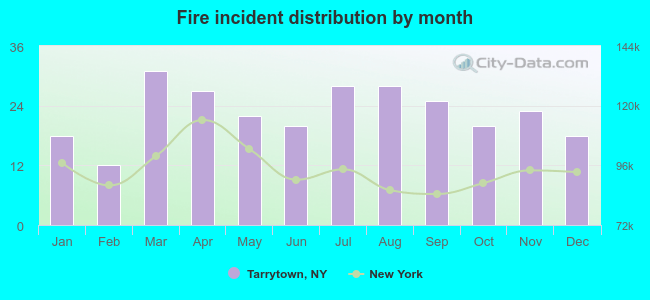 According to the 272 reports from years 2002 - 2018 most fires (11.4%) took place during March, and the least (4.4%) in February.
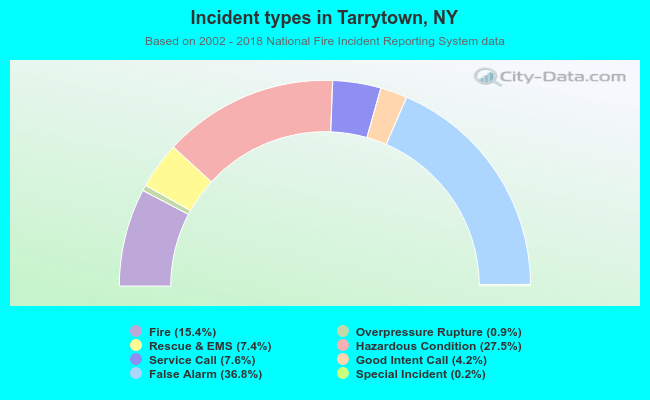 Out of all 1,768 cases reported during the years 2002 - 2018, the most belonged to the categories: False Alarm (36.8%), Hazardous Condition (27.5%), and Fire (15.4%).
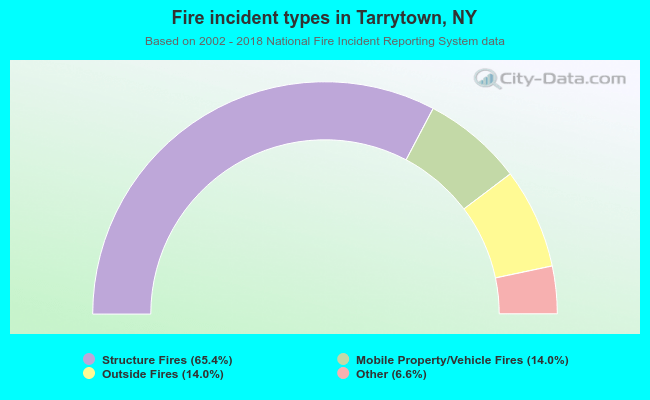 When looking into fire subcategories, the most reports belonged to: Structure Fires (65.4%), and Mobile Property/Vehicle Fires (14.0%).