Taunton: Fire Incidents, Massachusetts (MA)
Where are fire incidents reported in Taunton, MA
Something went wrong! Please refresh the page.
| Fire incidents reported | |
|---|---|
| Sreet name | Count |
| WINTHROP ST | 210 |
| WASHINGTON ST | 164 |
| COUNTY ST | 140 |
| BAY ST | 138 |
| TREMONT ST | 100 |
| HART ST | 86 |
| SOMERSET AVE | 86 |
| BROADWAY | 78 |
| INGELL ST | 74 |
| COHANNET ST | 70 |
| WEIR ST | 70 |
| WHITTENTON ST | 70 |
| DEWERT AVE | 68 |
| SCHOOL ST | 68 |
| PLAIN ST | 54 |
| SUMMER ST | 52 |
| DEAN ST | 50 |
| MIDDLEBORO AVE | 50 |
| WILLIAMS ST | 48 |
| HIGH ST | 44 |
| JOHN HANCOCK RD | 44 |
| MYLES STANDISH BLVD | 44 |
| TAUNTON DEPOT DR | 44 |
| NORTON AVE | 42 |
| FIRST ST | 38 |
| FREMONT ST | 36 |
| OAK ST | 36 |
| ROUTE 24 (AMVETS HWY | 36 |
| GALLERIA MALL DR | 34 |
| PROSPECT HILL ST | 34 |
| Other | 554 |
2002 - 2018 National Fire Incident Reporting System (NFIRS) incidents
- Incident types reported to NFIRS in Taunton, MA
- 28,41562.3%Rescue & EMS
- 5,15311.3%False Alarm
- 4,0318.8%Service Call
- 2,6625.8%Fire
- 2,5395.6%Good Intent Call
- 2,3975.3%Hazardous Condition
- 3820.8%Special Incident
- Fire incident types reported to NFIRS in Taunton, MA
- 1,44254.2%Outside Fires
- 70526.5%Structure Fires
- 33112.4%Mobile Property/Vehicle Fires
- 1846.9%Other
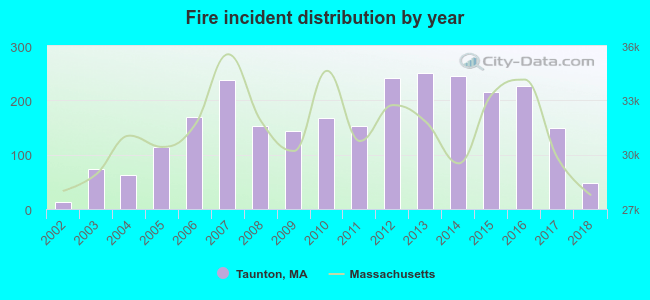 Based on the data from the years 2002 - 2018 the average number of fires per year is 157. The highest number of reported fires - 250 took place in 2013, and the least - 13 in 2002. The data has a growing trend.
The average number of yearly fire incidents per 10k residents in Taunton, MA compared to nearest cities:
(Note: Based on data for the last 3 years, including only cities with population 5,000 and above)
| Taunton: | 25.0 |
| Raynham: | 53.8 |
| Dighton: | 12.7 |
| Berkley: | 25.0 |
| Norton: | 20.0 |
| Lakeville: | 26.4 |
| Bridgewater: | 125.4 |
| West Bridgewater: | 57.4 |
| Freetown: | 4.5 |
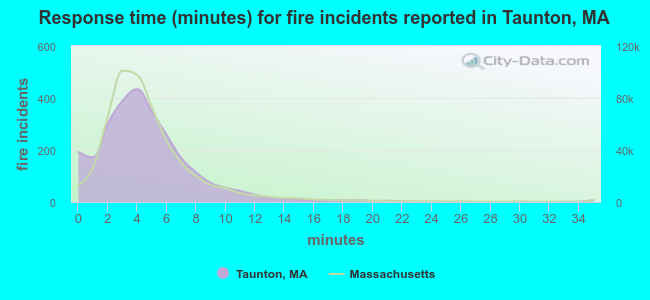 The median response time based on all reported fire incidents is 4 minutes. This is similar to the state median value.
The median response time in Taunton, MA compared to nearest cities:
(Note: Based on data for all years, including only cities with at least 500 fire incidents)
| Taunton: | 4 minutes |
| Raynham: | 4 minutes |
| Norton: | 4 minutes |
| Lakeville: | 6 minutes |
| Bridgewater: | 5 minutes |
| West Bridgewater: | 4 minutes |
| Rehoboth: | 6 minutes |
| Easton: | 5 minutes |
| Middleborough: | 5 minutes |
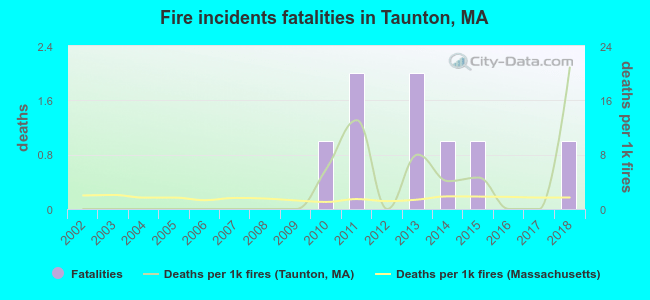 According to the data from the years 2002 - 2018 the average number of fire-related yearly deaths is 0. The highest number of reported deaths - 2 took place in 2011, and the lowest - 0 in 2002. The data has a growing trend.
The average number of fatalities per 1,000 fire incidents is 3. This indicator was the highest - 21 in 2018, and the lowest 0 in 2002. The trend for deaths per 1,000 fires is growing. Compared to the Massachusetts value the number of fatalities per 1,000 incidents is higher.
According to the data from the years 2002 - 2018 the average number of fire-related yearly deaths is 0. The highest number of reported deaths - 2 took place in 2011, and the lowest - 0 in 2002. The data has a growing trend.
The average number of fatalities per 1,000 fire incidents is 3. This indicator was the highest - 21 in 2018, and the lowest 0 in 2002. The trend for deaths per 1,000 fires is growing. Compared to the Massachusetts value the number of fatalities per 1,000 incidents is higher.Deaths per 1,000 incidents in Taunton, MA compared to nearest cities:
(Note: Based on data for all years, including only cities with at least 2,500 fire incidents)
| Taunton: | 3.0 |
| Brockton: | 3.3 |
| Fall River: | 2.6 |
| Stoughton: | 0.3 |
| Randolph: | 1.6 |
| New Bedford: | 2.2 |
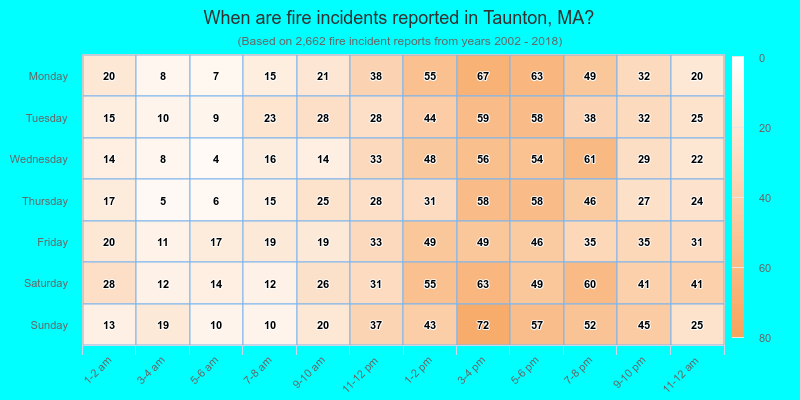
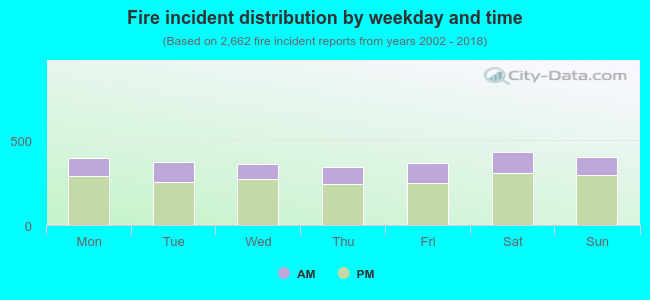 28.5% incidents where reported in the morning and 71.5% in the evening. The most fires (16.2%) took place on Saturday, and the least (12.8%) on Thursday.
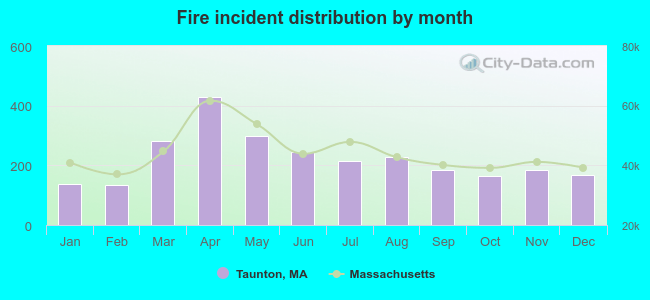 According to the 2,662 fires from years 2002 - 2018 most fires (16.1%) took place during April, and the least (5.1%) in February.
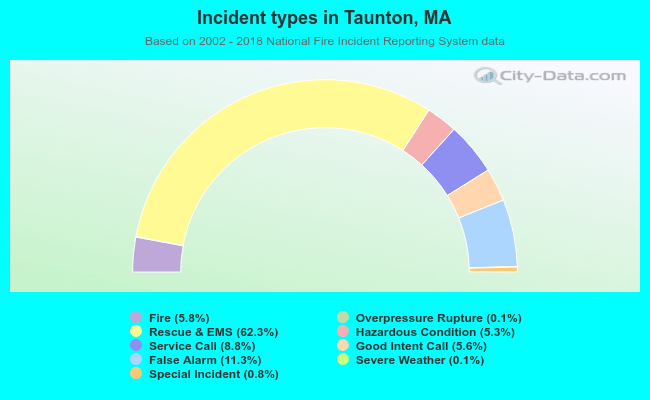 Out of all 45,645 cases reported during the years 2002 - 2018, the most belonged to the categories: Rescue & EMS (62.3%), False Alarm (11.3%), and Service Call (8.8%).
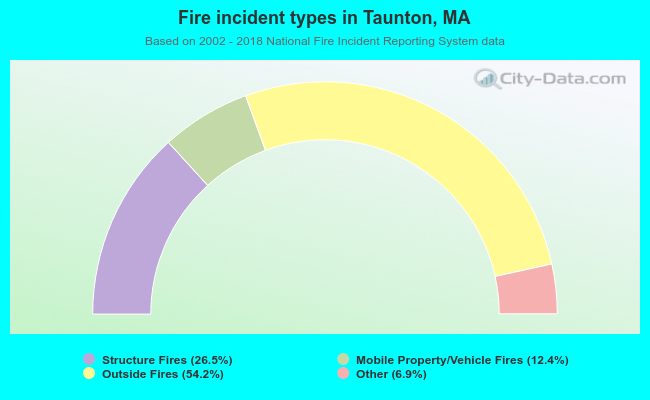 When looking into fire subcategories, the most reports belonged to: Outside Fires (54.2%), and Structure Fires (26.5%).