Taylor Mill: Fire Incidents, Kentucky (KY)
Where are fire incidents reported in Taylor Mill, KY
Something went wrong! Please refresh the page.
|
| |||||||||||||||||||||||||||||||||||||||||||||||||||||||||||||||||||||||||||||||||||||||||||||||||||||||||||||
2004 - 2018 National Fire Incident Reporting System (NFIRS) incidents
- Incident types reported to NFIRS in Taylor Mill, KY
- 1,24154.6%Rescue & EMS
- 37716.6%Hazardous Condition
- 28712.6%Fire
- 1607.0%Good Intent Call
- 1014.4%False Alarm
- 883.9%Service Call
- 150.7%Severe Weather
- 30.1%Overpressure Rupture
- Fire incident types reported to NFIRS in Taylor Mill, KY
- 10737.3%Structure Fires
- 9232.1%Outside Fires
- 7626.5%Mobile Property/Vehicle Fires
- 124.2%Other
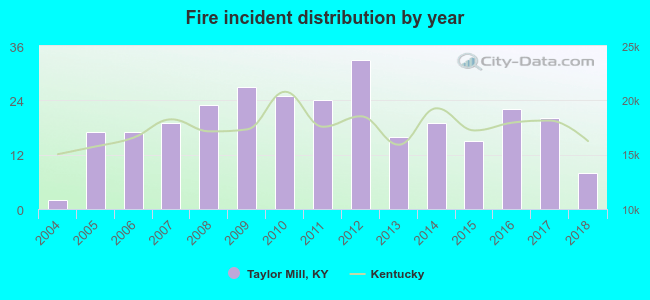 Based on the data from the years 2004 - 2018 the average number of fires per year is 19. The highest number of reported fire incidents - 33 took place in 2012, and the least - 2 in 2004. The data has a growing trend.
The average number of yearly fire incidents per 10k residents in Taylor Mill, KY compared to nearest cities:
(Note: Based on data for the last 3 years, including only cities with population 5,000 and above)
| Taylor Mill: | 24.8 |
| Highland Heights: | 13.4 |
| Cold Spring: | 24.3 |
| Fort Wright: | 20.3 |
| Covington: | 49.4 |
| Edgewood: | 17.9 |
| Fort Mitchell: | 26.6 |
| Fort Thomas: | 0.6 |
| Independence: | 26.2 |
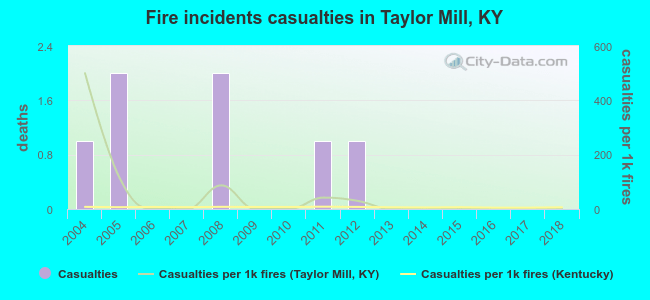 According to the reports from the years 2004 - 2018 the average number of fire-related casualties per year is 0. The highest number of reported injuries - 2 took place in 2005, and the lowest - 0 in 2006. The data has a decreasing trend.
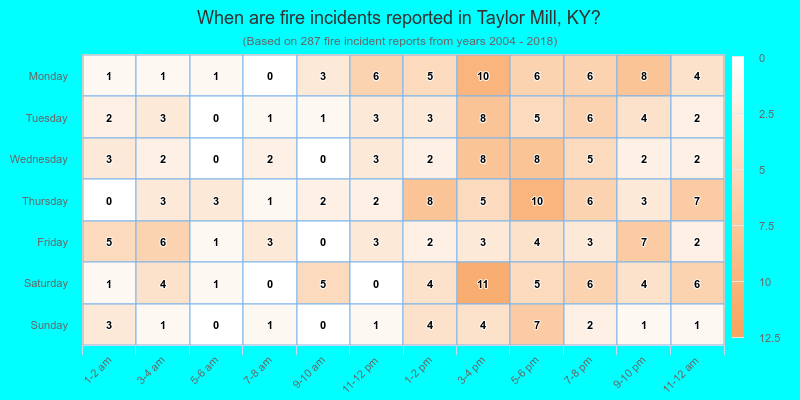
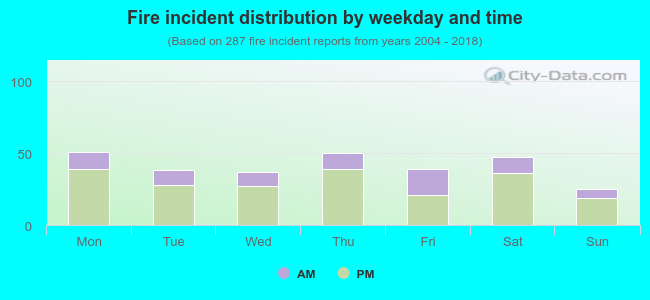 27.2% incidents where reported in the morning and 72.8% in the evening. The most fires (17.8%) took place on Monday, and the least (8.7%) on Sunday.
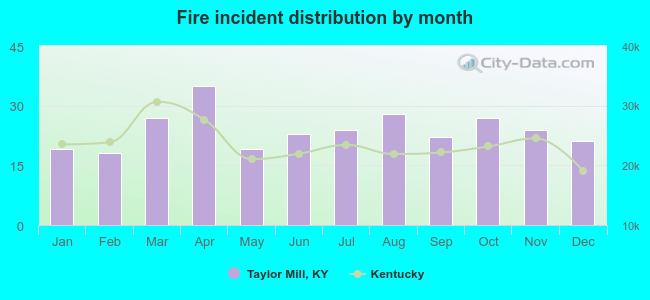 Based on the 287 reports from years 2004 - 2018 most fires (12.2%) took place during April, and the least (6.3%) in February.
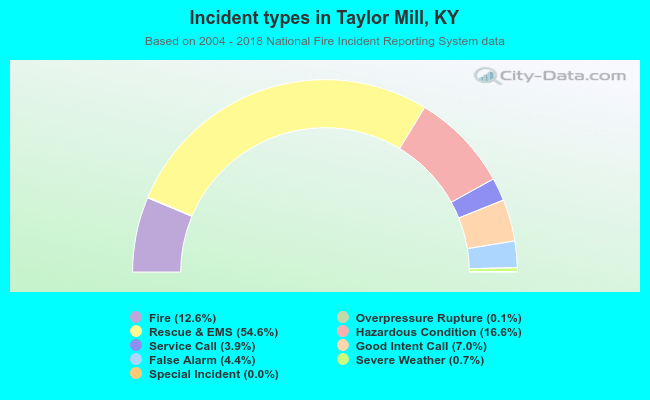 Out of all 2,273 cases reported during the years 2004 - 2018, the most belonged to the categories: Rescue & EMS (54.6%), Hazardous Condition (16.6%), and Fire (12.6%).
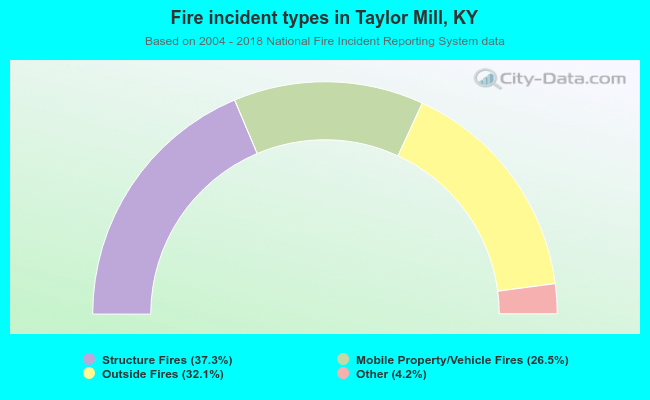 When looking into fire subcategories, the most reports belonged to: Structure Fires (37.3%), and Outside Fires (32.1%).