Tishomingo: Fire Incidents, Mississippi (MS)
Where are fire incidents reported in Tishomingo, MS
Something went wrong! Please refresh the page.
|
| |||||||||||||||||||||||||||||||||||||||||||||||||||||||||||||||||||||||||||||||||||||||||||||||||||||||||||||
2003 - 2018 National Fire Incident Reporting System (NFIRS) incidents
- Incident types reported to NFIRS in Tishomingo, MS
- 80350.9%Fire
- 60138.1%Rescue & EMS
- 613.9%Good Intent Call
- 462.9%Hazardous Condition
- 322.0%Service Call
- 201.3%False Alarm
- 150.9%Severe Weather
- Fire incident types reported to NFIRS in Tishomingo, MS
- 47158.7%Outside Fires
- 24430.4%Structure Fires
- 708.7%Mobile Property/Vehicle Fires
- 182.2%Other
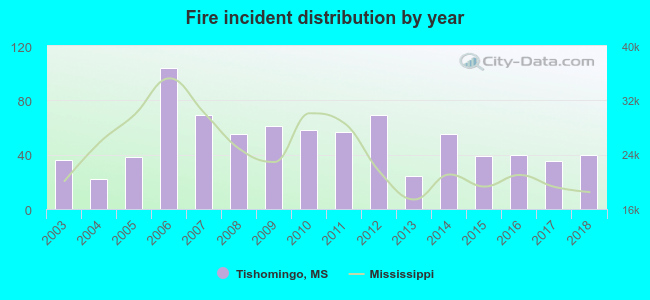 According to the data from the years 2003 - 2018 the average number of fires per year is 50. The highest number of fire incidents - 104 took place in 2006, and the least - 22 in 2004. The data has a growing trend.
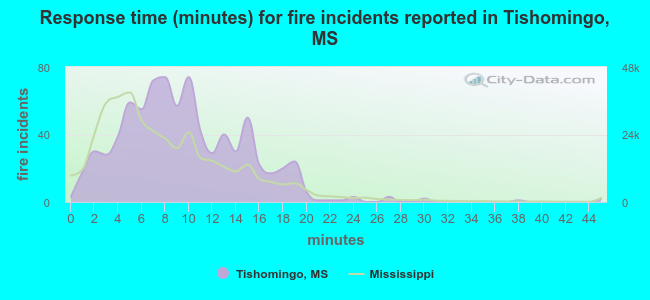 The median response time based on all reported fire incidents is 9 minutes. This is higher compared to the Mississippi median value.
The median response time in Tishomingo, MS compared to nearest cities:
(Note: Based on data for all years, including only cities with at least 500 fire incidents)
| Tishomingo: | 9 minutes |
| Belmont: | 5 minutes |
| Golden: | 7 minutes |
| Iuka: | 8 minutes |
| Burnsville: | 6 minutes |
| Marietta: | 9 minutes |
| Glen: | 8 minutes |
| Booneville: | 10 minutes |
| Rienzi: | 11 minutes |
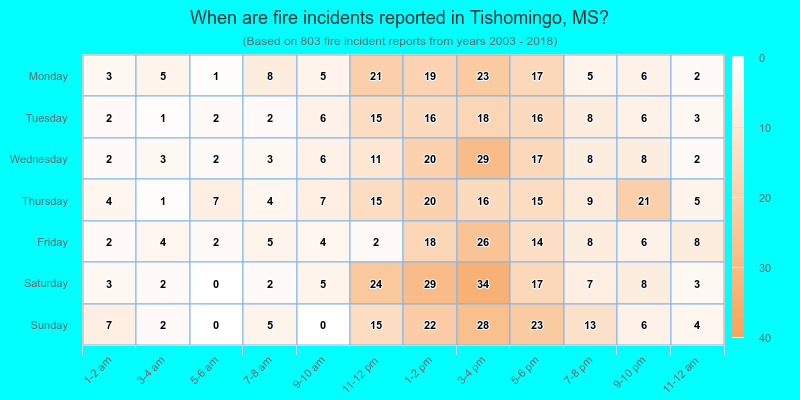
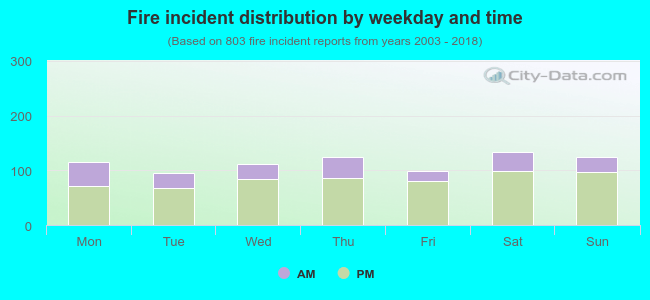 27.4% incidents where reported in the morning and 72.6% in the evening. The most fires (16.7%) took place on Saturday, and the least (11.8%) on Tuesday.
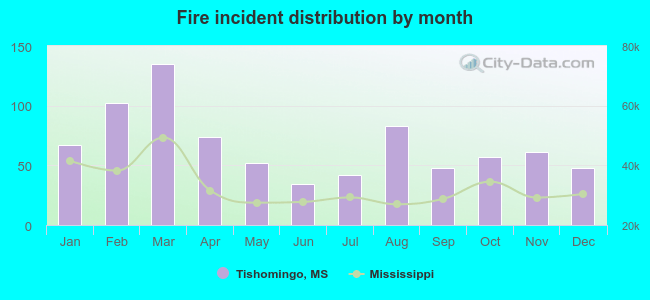 Based on the 803 incident reports from years 2003 - 2018 most fires (16.8%) took place during March, and the least (4.2%) in June.
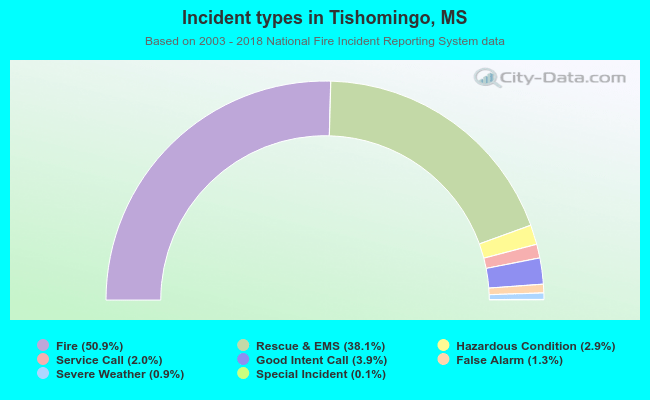 Out of all 1,579 cases reported during the years 2003 - 2018, the most belonged to the categories: Fire (50.9%), Overpressure Rupture (38.1%), and Service Call (3.9%).
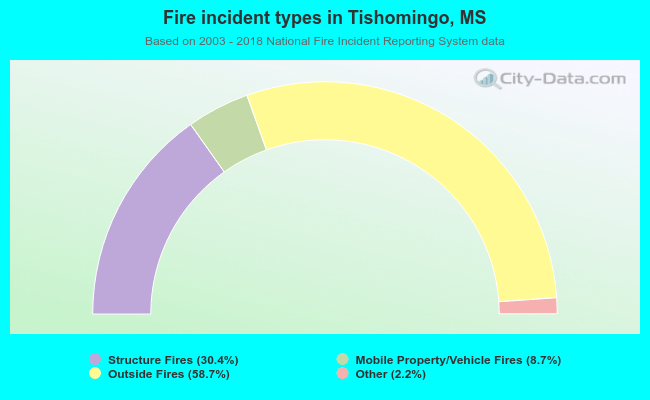 When looking into fire subcategories, the most incidents belonged to: Outside Fires (58.7%), and Structure Fires (30.4%).