| Fire incidents reported |
|---|
| Sreet name | Count |
|---|
| INTERSTATE 81 HWY | 76 | | MAIN ST | 40 | | MOUNT OLIVE RD | 36 | | COUNTRY BROOK RD | 28 | | BURKE HILL RD | 18 | | BACK RD | 14 | | OLD VALLEY PIKE | 14 | | HEISHMANS PARK | 12 | | I-81 | 12 | | MT OLIVE RD | 10 | | HARRISVILLE RD | 8 | | HEADLEY RD | 8 | | JESSICA PL | 6 | | KING ST | 6 | | MT HEBRON RD | 6 | | MT. OLIVE RD | 6 | | ROUND HILL PARK | 6 | | TOLL HOUSE RD | 6 | | BROOK CREEK RD | 4 | | HAHNS LN | 4 | | I81 288 MM INST | 4 | | I81 291 MM INST | 4 | | KELLER RD | 4 | | MOUNT HEBRON RD | 4 | | MT. HEBRON RD | 4 |
| | | Fire incidents reported |
|---|
| Sreet name | Count |
|---|
| PONTZER RD | 4 | | RIVERVIEW DR | 4 | | ROBERTS RD | 4 | | TEABERRY RD | 4 | | 1015 MT OLIVE RD | 2 | | 1448 SWARTZ RD | 2 | | 1508 MT HEBRON RD | 2 | | 285 I-81 SB | 2 | | 285 I81 NB | 2 | | 288 NB I81 | 2 | | 28999 OLD VALLEY PIKE | 2 | | 293 NB I-81 | 2 | | 293 NB I81 | 2 | | 300 COPP ROAD | 2 | | ALONZAUILLE RD | 2 | | BACK ROAD | 2 | | BURKE RD | 2 | | CATTLE LN | 2 | | COUNTRY BROOK & HARRISVILLE RD | 2 | | COUNTY FARM LN | 2 | | CREEK RD | 2 | | CREEK RDS MAIN STREET RDS | 2 | | DEAN RD | 2 | | FORT VALLEY RD | 2 | | FT. BOWMAN RD | 2 |
|
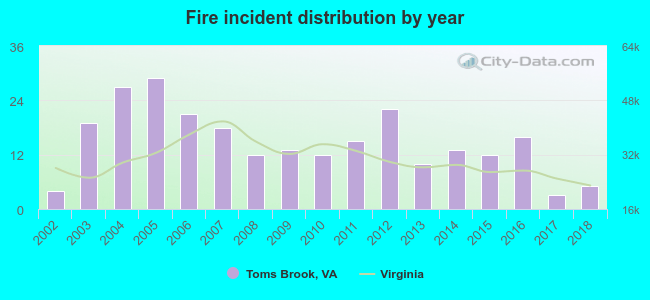 Based on the data from the years 2002 - 2018 the average number of fire incidents per year is 15. The highest number of fires - 29 took place in 2005, and the least - 3 in 2017. The data has a growing trend.
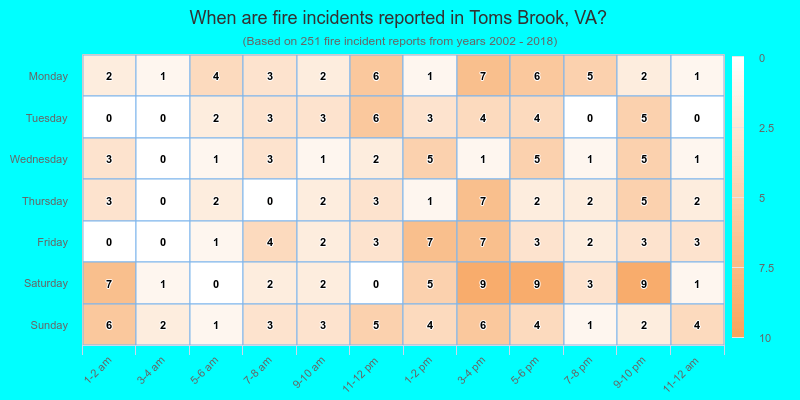
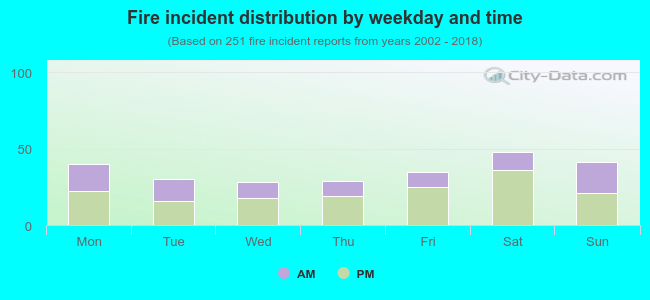 37.5% incidents where reported in the morning and 62.5% in the evening. The most fires (19.1%) took place on Saturday, and the least (11.2%) on Wednesday.
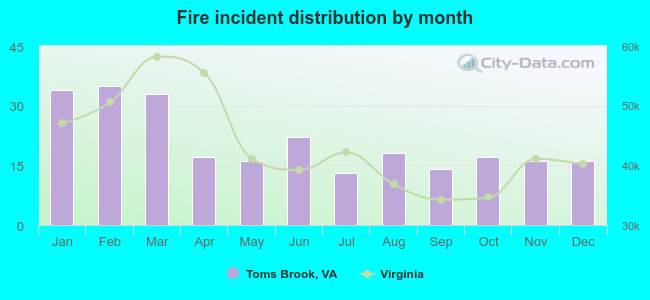 According to the 251 fire incident reports from years 2002 - 2018 most fires (13.9%) took place during February, and the least (5.2%) in July.
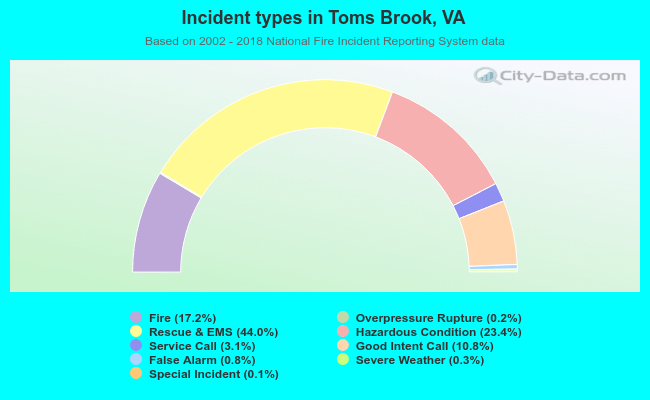 Out of all 1,462 cases reported during the years 2002 - 2018, the most belonged to the categories: Rescue & EMS (44.0%), Hazardous Condition (23.4%), and Fire (17.2%).
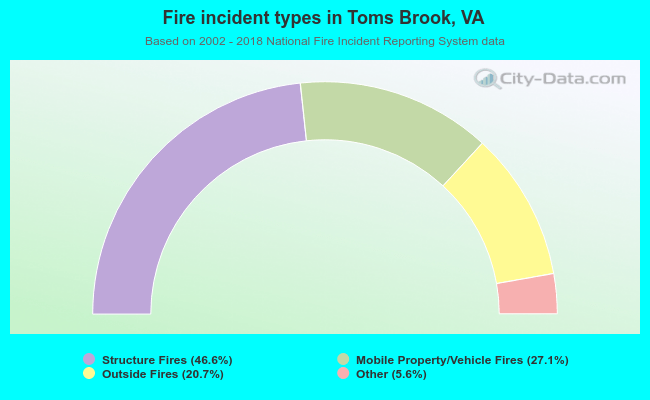 When looking into fire subcategories, the most reports belonged to: Structure Fires (46.6%), and Mobile Property/Vehicle Fires (27.1%).