Trenton: Fire Incidents, Missouri (MO)
Where are fire incidents reported in Trenton, MO
Something went wrong! Please refresh the page.
| Fire incidents reported | |
|---|---|
| Sreet name | Count |
| 10TH ST | 26 |
| 9TH ST | 22 |
| 13TH ST | 20 |
| CHESTNUT ST | 16 |
| OKLAHOMA AVE | 14 |
| 12TH ST | 10 |
| IOWA BLVD | 10 |
| LAKESIDE PL | 10 |
| MAIN ST | 10 |
| 15TH ST | 8 |
| 17TH ST | 8 |
| 8TH ST | 8 |
| 9TH CT | 8 |
| HARRIS AVE | 8 |
| MABLE ST | 8 |
| 10TH AVE | 6 |
| 13TH | 6 |
| 14TH ST | 6 |
| 1ST ST | 6 |
| 20TH ST | 6 |
| 20TH ST | 6 |
| 212 E 10TH ST | 6 |
| 28TH ST | 6 |
| 3031 PLEASANT PLAIN | 6 |
| 375 NW 5TH ST | 6 |
| 6 HWY | 6 |
| 610 W 18TH ST | 6 |
| 7138 LIV 504 | 6 |
| CROWDER RD | 6 |
| HWY 6 | 6 |
| Other | 753 |
2002 - 2018 National Fire Incident Reporting System (NFIRS) incidents
- Incident types reported to NFIRS in Trenton, MO
- 1,02934.8%Fire
- 97432.9%Rescue & EMS
- 39213.3%Hazardous Condition
- 2087.0%Good Intent Call
- 1766.0%False Alarm
- 1675.6%Service Call
- 50.2%Overpressure Rupture
- 40.1%Severe Weather
- Fire incident types reported to NFIRS in Trenton, MO
- 45243.9%Outside Fires
- 36135.1%Structure Fires
- 14514.1%Mobile Property/Vehicle Fires
- 716.9%Other
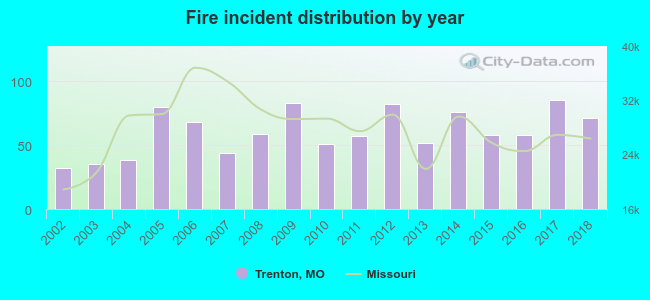 Based on the data from the years 2002 - 2018 the average number of fires per year is 61. The highest number of reported fire incidents - 85 took place in 2017, and the least - 32 in 2002. The data has a growing trend.
The average number of yearly fire incidents per 10k residents in Trenton, MO compared to nearest cities:
(Note: Based on data for the last 3 years, including only cities with population 5,000 and above)
| Trenton: | 119.8 |
| Chillicothe: | 16.1 |
| Cameron: | 45.1 |
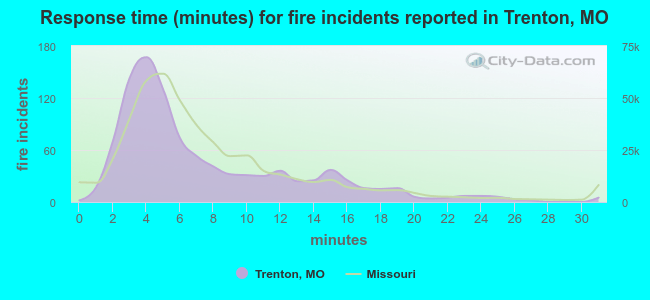 The median response time based on all reported fire incidents is 5 minutes. This is lower compared to the state median value.
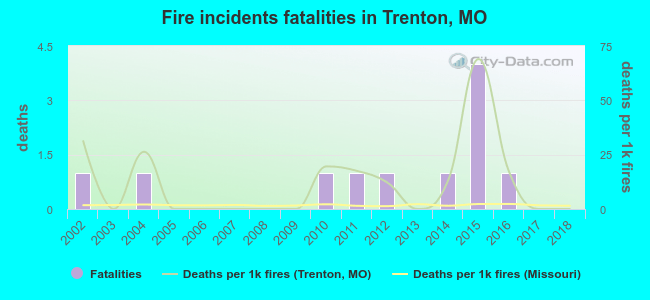 According to the data from the years 2002 - 2018 the average number of fire-related yearly deaths is 1. The highest number of deaths - 4 took place in 2015, and the lowest - 0 in 2003. The data has a declining trend.
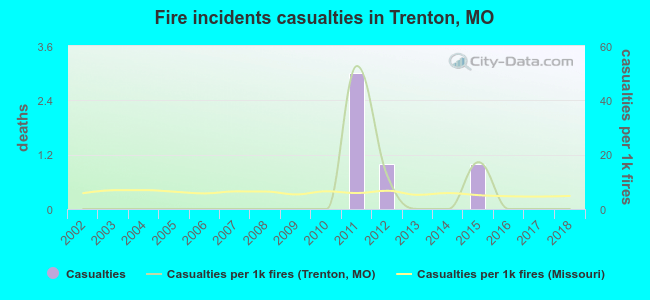 Based on the reports from the years 2002 - 2018 the average number of fire-related yearly casualties is 0. The highest number of reported injuries - 3 took place in 2011, and the lowest - 0 in 2002. The data has a constant trend.
The average number of injuries per 1,000 fires is 5. This indicator was the highest - 53 in 2011, and the lowest 0 in 2002. The trend for casualties per 1,000 fires is constant. Compared to the Missouri value the number of injuries per 1,000 fire incidents is lower.
Based on the reports from the years 2002 - 2018 the average number of fire-related yearly casualties is 0. The highest number of reported injuries - 3 took place in 2011, and the lowest - 0 in 2002. The data has a constant trend.
The average number of injuries per 1,000 fires is 5. This indicator was the highest - 53 in 2011, and the lowest 0 in 2002. The trend for casualties per 1,000 fires is constant. Compared to the Missouri value the number of injuries per 1,000 fire incidents is lower.
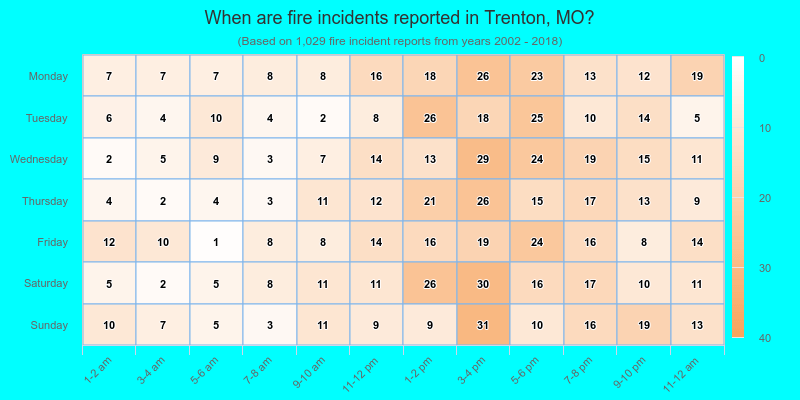
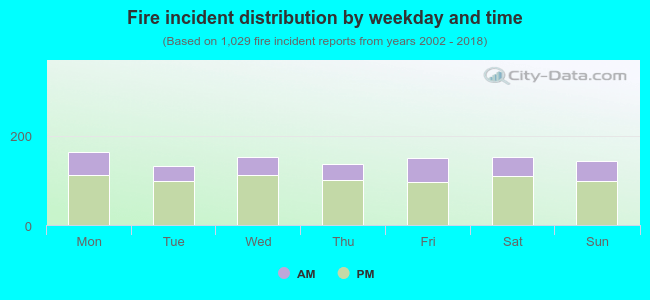 29.4% incidents where reported in the morning and 70.6% in the evening. The most fires (15.9%) took place on Monday, and the least (12.8%) on Tuesday.
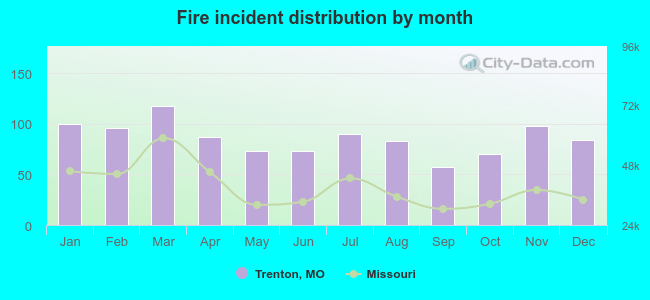 According to the 1,029 fire incident reports from years 2002 - 2018 most fires (11.5%) took place during March, and the least (5.5%) in September.
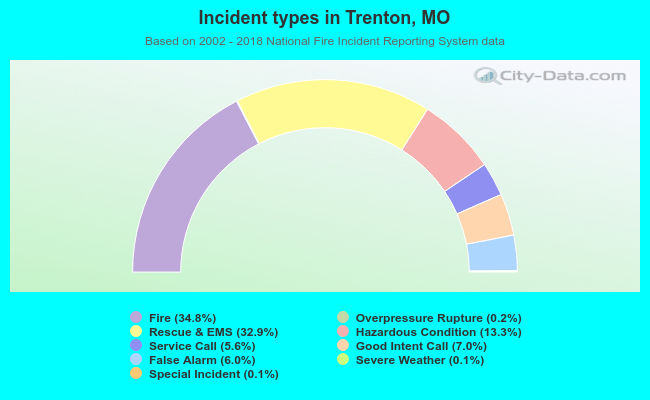 Out of all 2,957 cases reported during the years 2002 - 2018, the most belonged to the categories: Fire (34.8%), Rescue & EMS (32.9%), and Hazardous Condition (13.3%).
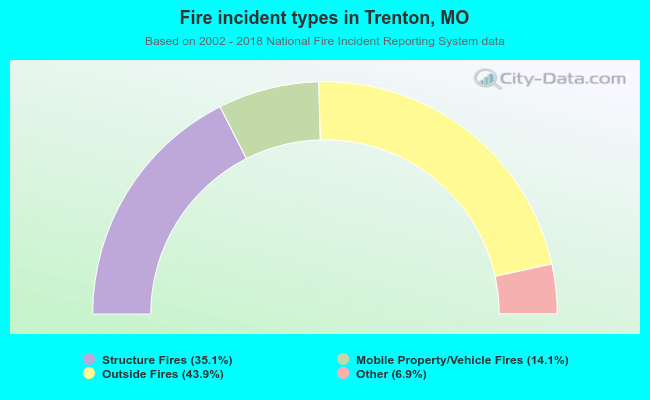 When looking into fire subcategories, the most incidents belonged to: Outside Fires (43.9%), and Structure Fires (35.1%).