Uniondale: Fire Incidents, New York (NY)
Where are fire incidents reported in Uniondale, NY
Something went wrong! Please refresh the page.
|
| |||||||||||||||||||||||||||||||||||||||||||||||||||||||||||||||||||||||||||||||||||||||||||||||||||||||||||||
2006 - 2018 National Fire Incident Reporting System (NFIRS) incidents
- Incident types reported to NFIRS in Uniondale, NY
- 1,36630.4%Rescue & EMS
- 1,29128.7%False Alarm
- 60813.5%Hazardous Condition
- 56412.6%Good Intent Call
- 3768.4%Fire
- 2525.6%Service Call
- 260.6%Special Incident
- 80.2%Overpressure Rupture
- Fire incident types reported to NFIRS in Uniondale, NY
- 11430.3%Structure Fires
- 11129.5%Outside Fires
- 7820.7%Other
- 7319.4%Mobile Property/Vehicle Fires
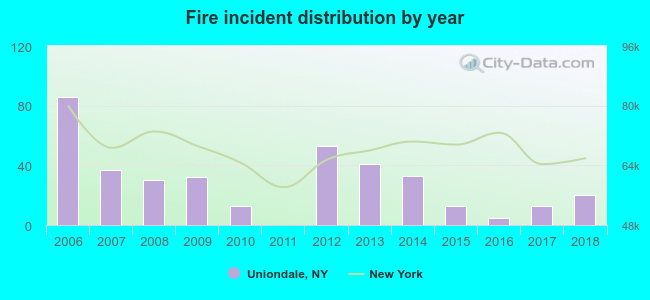 Based on the data from the years 2006 - 2018 the average number of fire incidents per year is 29. The highest number of fires - 86 took place in 2006, and the least - 0 in 2011. The data has a dropping trend.
The average number of yearly fire incidents per 10k residents in Uniondale, NY compared to nearest cities:
(Note: Based on data for the last 3 years, including only cities with population 5,000 and above)
| Uniondale: | 5.1 |
| Hempstead: | 31.0 |
| Roosevelt: | 39.4 |
| East Meadow: | 3.1 |
| North Merrick: | 6.9 |
| Baldwin: | 29.4 |
| North Bellmore: | 5.8 |
| West Hempstead: | 19.8 |
| Salisbury: | 5.0 |
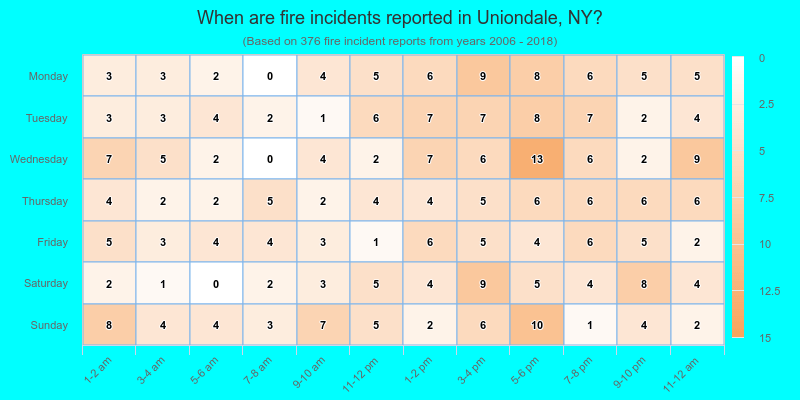
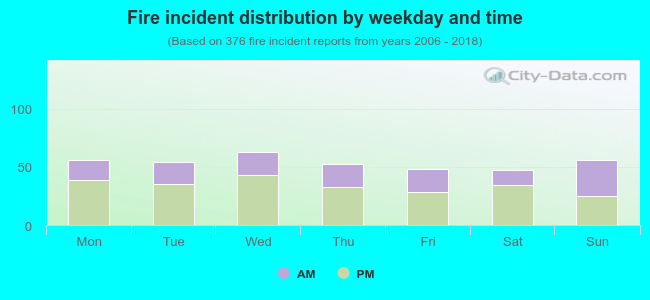 37.0% incidents where reported in the morning and 63.0% in the evening. The most fires (16.8%) took place on Wednesday, and the least (12.5%) on Saturday.
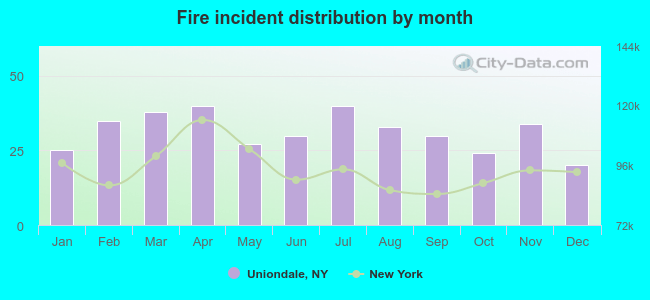 Based on the 376 fires from years 2006 - 2018 most fires (10.6%) took place during April, and the least (5.3%) in December.
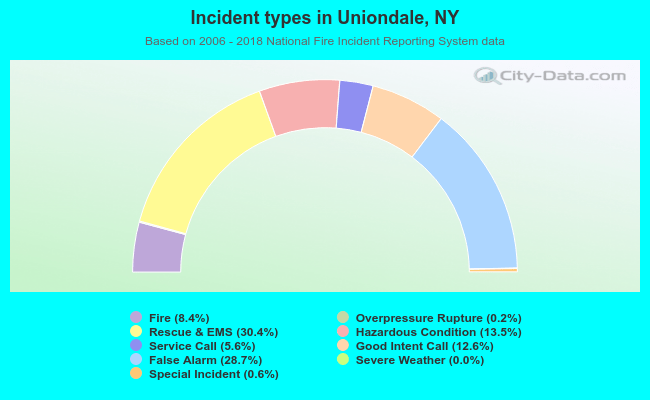 Out of all 4,493 cases reported during the years 2006 - 2018, the most belonged to the categories: Rescue & EMS (30.4%), False Alarm (28.7%), and Hazardous Condition (13.5%).
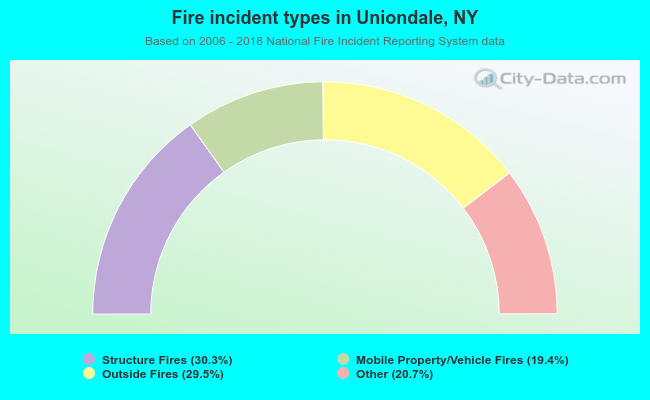 When looking into fire subcategories, the most reports belonged to: Structure Fires (30.3%), and Outside Fires (29.5%).