Universal City: Fire Incidents, Texas (TX)
Where are fire incidents reported in Universal City, TX
Something went wrong! Please refresh the page.
| Fire incidents reported | |
|---|---|
| Sreet name | Count |
| PAT BOOKER RD | 166 |
| LOOP 1604 | 142 |
| PAT BOOKER | 120 |
| KITTY HAWK RD | 86 |
| KITTY HAWK | 66 |
| UNIVERSAL CITY BLVD | 54 |
| PAT BOOKER RD | 40 |
| AVIATION | 38 |
| AVIATION BLVD | 28 |
| PALISADES DR | 28 |
| PARK OLYMPIA | 26 |
| PAT BOOKER RD. | 22 |
| VILLA DR | 22 |
| WAGON CROSSING | 22 |
| 1604 LOOP | 20 |
| UNIVERSAL CITY | 20 |
| UNIVERSAL CITY BLVD | 20 |
| ATHENIAN | 18 |
| AVIATION BLVDEAST | 18 |
| KITTY HAWK RD | 18 |
| SUNRISE CANYON | 18 |
| CIBOLO TRAIL | 16 |
| FM 78 | 16 |
| GUILFORD FORGE | 16 |
| OLD CIMARRON TRL | 16 |
| PALISADES | 16 |
| WRIGHT BLVD | 16 |
| GARDEN MEADOW | 14 |
| LANGLEY | 14 |
| PARK LANE | 14 |
2002 - 2018 National Fire Incident Reporting System (NFIRS) incidents
- Incident types reported to NFIRS in Universal City, TX
- 7,78366.9%Rescue & EMS
- 1,0929.4%Fire
- 8797.6%Hazardous Condition
- 7886.8%Service Call
- 5865.0%False Alarm
- 4624.0%Good Intent Call
- 150.1%Overpressure Rupture
- 150.1%Special Incident
- 120.1%Severe Weather
- Fire incident types reported to NFIRS in Universal City, TX
- 44640.8%Outside Fires
- 43740.0%Structure Fires
- 12711.6%Mobile Property/Vehicle Fires
- 827.5%Other
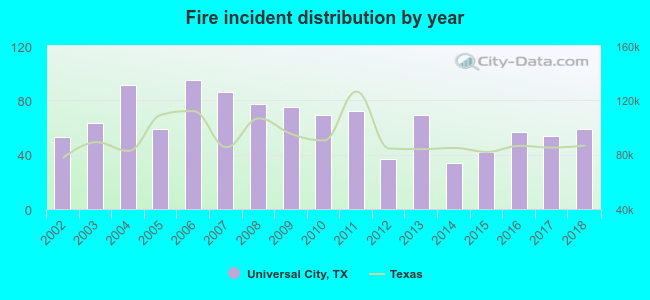 Based on the data from the years 2002 - 2018 the average number of fire incidents per year is 64. The highest number of reported fires - 95 took place in 2006, and the least - 34 in 2014. The data has a rising trend.
The average number of yearly fire incidents per 10k residents in Universal City, TX compared to nearest cities:
(Note: Based on data for the last 3 years, including only cities with population 5,000 and above)
| Universal City: | 28.7 |
| Live Oak: | 4.0 |
| Converse: | 21.2 |
| Selma: | 31.4 |
| Schertz: | 32.5 |
| Cibolo: | 29.5 |
| Windcrest: | 17.5 |
| Kirby: | 30.8 |
| Terrell Hills: | 7.7 |
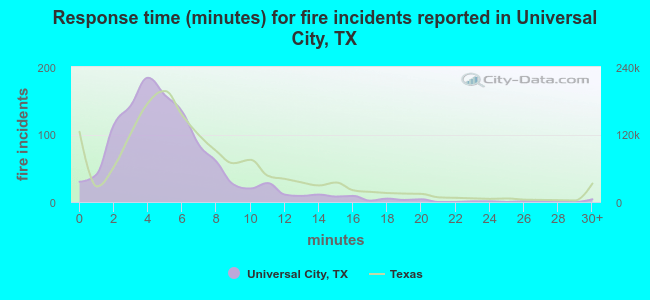 The median response time based on all reported fire incidents is 5 minutes. This is lower than the Texas median value.
The median response time in Universal City, TX compared to nearest cities:
(Note: Based on data for all years, including only cities with at least 500 fire incidents)
| Universal City: | 5 minutes |
| Converse: | 6 minutes |
| Schertz: | 7 minutes |
| Cibolo: | 8 minutes |
| San Antonio: | 5 minutes |
| New Braunfels: | 7 minutes |
| Bulverde: | 9 minutes |
| Seguin: | 8 minutes |
| Canyon Lake: | 9 minutes |
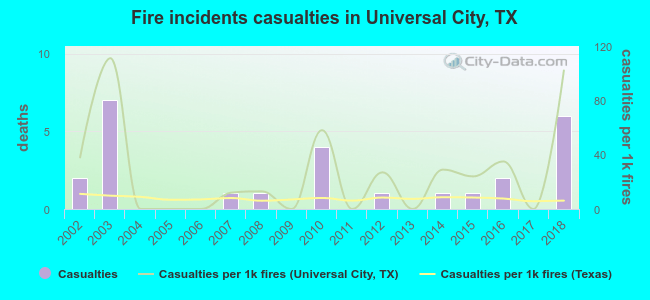 Based on the data from the years 2002 - 2018 the average number of fire-related yearly casualties is 2. The highest number of injuries - 7 took place in 2003, and the lowest - 0 in 2004. The data has a rising trend.
The average number of casualties per 1,000 fires is 26. This indicator was the highest - 111 in 2003, and the lowest 0 in 2004. The trend for casualties per 1,000 fire incidents is increasing. Compared to the Texas value the number of injuries per 1,000 fires is much higher.
Based on the data from the years 2002 - 2018 the average number of fire-related yearly casualties is 2. The highest number of injuries - 7 took place in 2003, and the lowest - 0 in 2004. The data has a rising trend.
The average number of casualties per 1,000 fires is 26. This indicator was the highest - 111 in 2003, and the lowest 0 in 2004. The trend for casualties per 1,000 fire incidents is increasing. Compared to the Texas value the number of injuries per 1,000 fires is much higher.Casualties per 1,000 incidents in Universal City, TX compared to nearest cities:
(Note: Based on data for all years, including only cities with at least 500 fire incidents)
| Universal City: | 23.8 |
| Converse: | 5.6 |
| Schertz: | 7.5 |
| Cibolo: | 5.2 |
| San Antonio: | 4.0 |
| New Braunfels: | 11.2 |
| Bulverde: | 0.0 |
| Seguin: | 11.7 |
| Canyon Lake: | 2.2 |
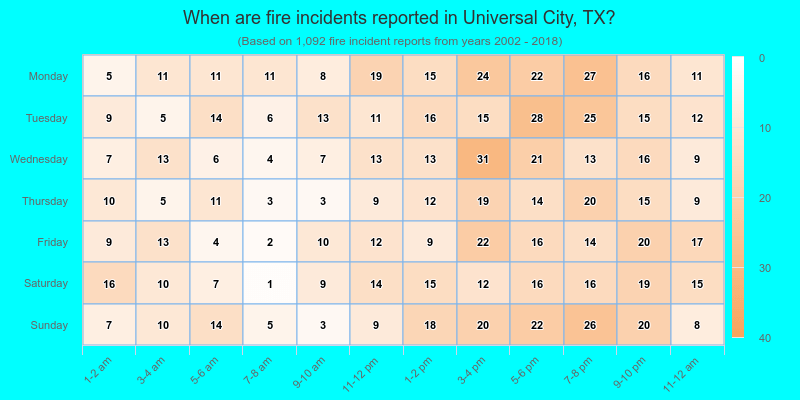
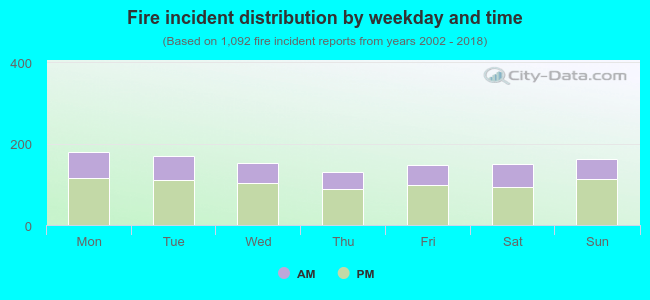 33.8% incidents where reported in the morning and 66.2% in the evening. The most fires (16.5%) took place on Monday, and the least (11.9%) on Thursday.
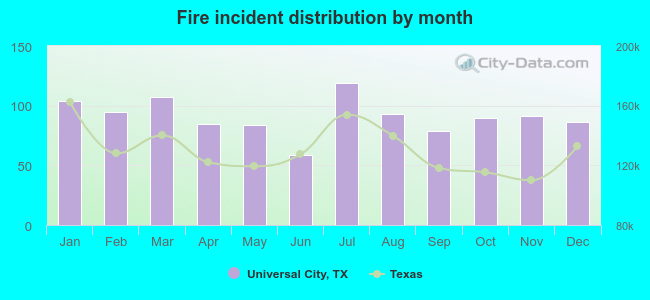 Based on the 1,092 fires from years 2002 - 2018 most fires (10.9%) took place during July, and the least (5.4%) in June.
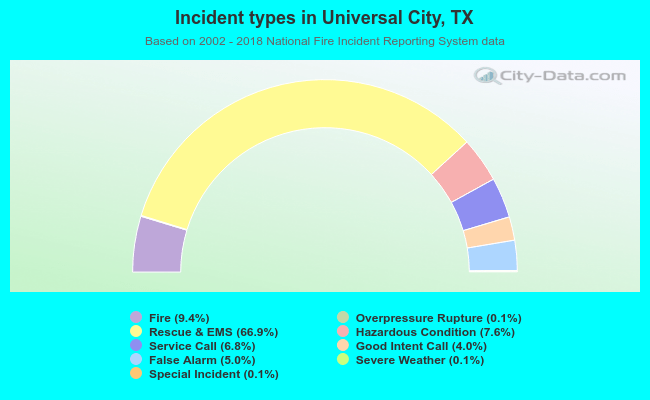 Out of all 11,632 cases reported during the years 2002 - 2018, the most belonged to the categories: Rescue & EMS (66.9%), Fire (9.4%), and Hazardous Condition (7.6%).
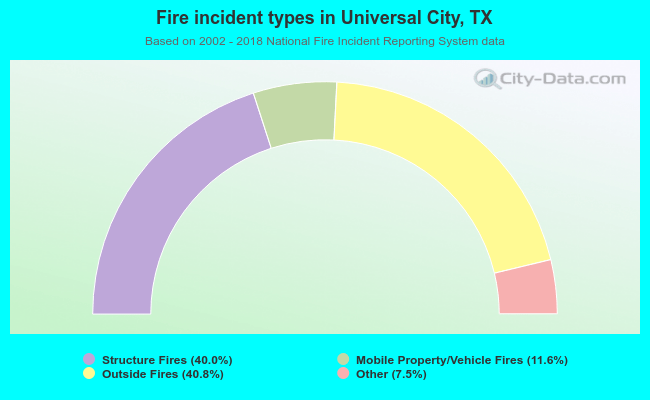 When looking into fire subcategories, the most reports belonged to: Outside Fires (40.8%), and Structure Fires (40.0%).