Utica: Fire Incidents, Michigan (MI)
Where are fire incidents reported in Utica, MI
Something went wrong! Please refresh the page.
|
| |||||||||||||||||||||||||||||||||||||||||||||||||||||||||||||||||||||||||||||||||||||||||||||||||||||||||||||
2002 - 2018 National Fire Incident Reporting System (NFIRS) incidents
- Incident types reported to NFIRS in Utica, MI
- 4,74774.5%Rescue & EMS
- 6039.5%Hazardous Condition
- 3856.0%False Alarm
- 3826.0%Fire
- 1061.7%Special Incident
- 751.2%Good Intent Call
- 671.1%Service Call
- 100.2%Overpressure Rupture
- Fire incident types reported to NFIRS in Utica, MI
- 18749.0%Structure Fires
- 7920.7%Mobile Property/Vehicle Fires
- 7018.3%Outside Fires
- 4612.0%Other
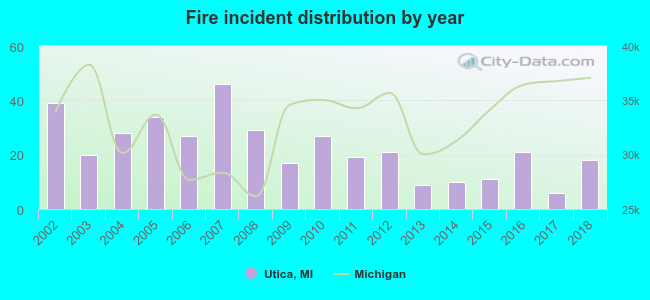 Based on the data from the years 2002 - 2018 the average number of fire incidents per year is 22. The highest number of reported fire incidents - 46 took place in 2007, and the least - 6 in 2017. The data has a declining trend.
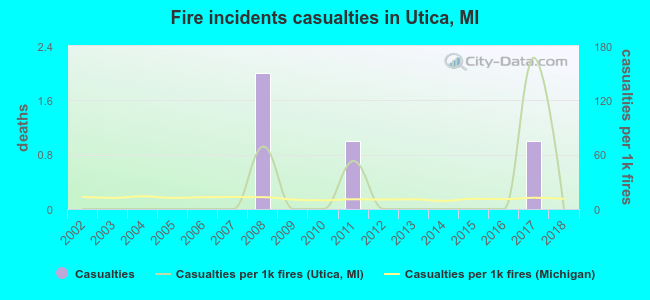 According to the data from the years 2002 - 2018 the average number of fire-related casualties per year is 0. The highest number of reported casualties - 2 took place in 2008, and the lowest - 0 in 2002. The data has a constant trend.
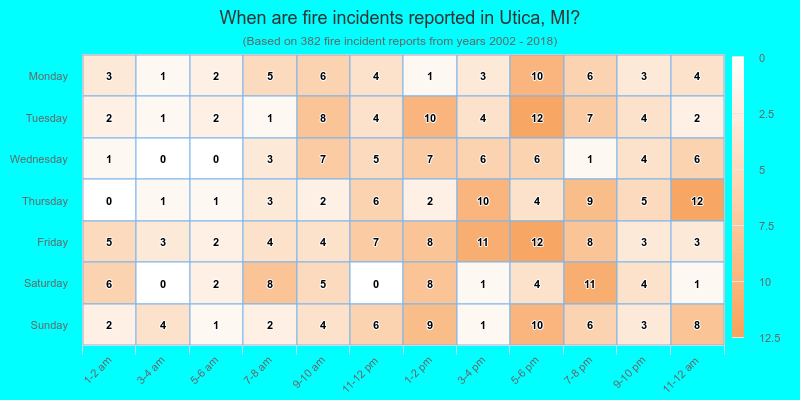
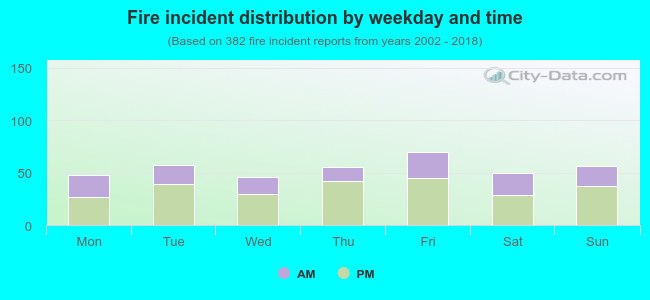 34.8% incidents where reported in the morning and 65.2% in the evening. The most fires (18.3%) took place on Friday, and the least (12.0%) on Wednesday.
 According to the 382 reports from years 2002 - 2018 most fires (10.5%) took place during February, and the least (6.0%) in May.
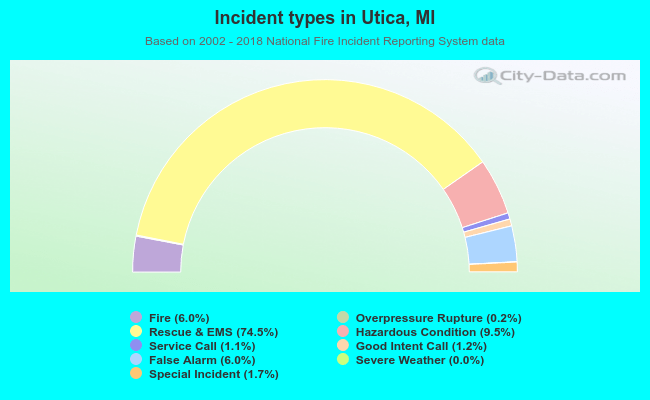 Out of all 6,376 cases reported during the years 2002 - 2018, the most belonged to the categories: Rescue & EMS (74.5%), Hazardous Condition (9.5%), and False Alarm (6.0%).
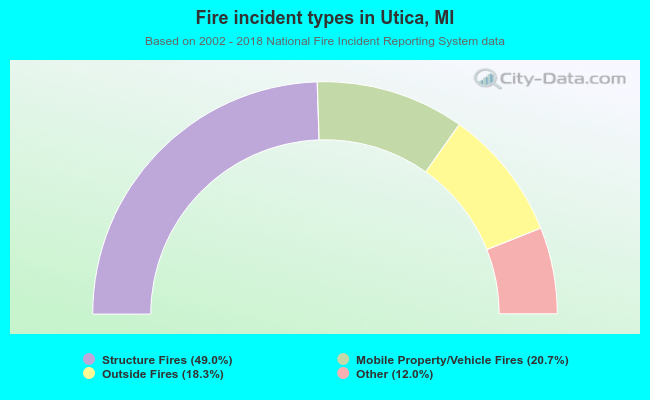 When looking into fire subcategories, the most incidents belonged to: Structure Fires (49.0%), and Mobile Property/Vehicle Fires (20.7%).