Valdosta: Fire Incidents, Georgia (GA)
Where are fire incidents reported in Valdosta, GA
Something went wrong! Please refresh the page.
| Fire incidents reported | |
|---|---|
| Sreet name | Count |
| BEMISS RD | 326 |
| PARK AVE | 290 |
| HILL AVE | 282 |
| MADISON HWY | 246 |
| OLD STATENVILLE RD | 216 |
| PATTERSON ST | 194 |
| ASHLEY ST | 182 |
| HWY 84 | 178 |
| NORTHSIDE DR | 158 |
| OLD CLYATTVILLE RD | 158 |
| FORREST ST | 148 |
| I-75 | 146 |
| INNER PERIMETER RD | 128 |
| ST AUGUSTINE RD | 126 |
| NORMAN DR | 120 |
| OAK ST | 120 |
| TROUP ST | 114 |
| BAYTREE RD | 112 |
| LEE ST | 102 |
| I75 | 100 |
| FRY ST | 96 |
| ST. AUGUSTINE RD | 94 |
| BROOKWOOD DR | 92 |
| HWY 41 | 86 |
| HICKORY GROVE RD | 84 |
| VALDOSTA RD | 84 |
| MAGNOLIA ST | 80 |
| GORNTO RD | 74 |
| OUSLEY RD | 70 |
| CAT CREEK RD | 68 |
| Other | 2,811 |
2004 - 2018 National Fire Incident Reporting System (NFIRS) incidents
- Incident types reported to NFIRS in Valdosta, GA
- 7,08523.7%Fire
- 6,32721.2%Rescue & EMS
- 6,21120.8%Hazardous Condition
- 4,70115.7%False Alarm
- 2,3327.8%Good Intent Call
- 1,7515.9%Service Call
- 9783.3%Special Incident
- 4571.5%Severe Weather
- 340.1%Overpressure Rupture
- Fire incident types reported to NFIRS in Valdosta, GA
- 3,31446.8%Outside Fires
- 2,47034.9%Structure Fires
- 1,18716.8%Mobile Property/Vehicle Fires
- 1141.6%Other
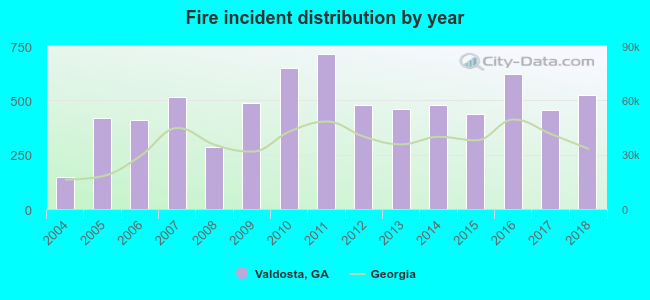 According to the data from the years 2004 - 2018 the average number of fire incidents per year is 472. The highest number of fires - 714 took place in 2011, and the least - 147 in 2004. The data has an increasing trend.
The average number of yearly fire incidents per 10k residents in Valdosta, GA compared to nearest cities:
(Note: Based on data for the last 3 years, including only cities with population 5,000 and above)
| Valdosta: | 94.2 |
| Adel: | 165.4 |
| Moultrie: | 179.5 |
| Thomasville: | 88.1 |
| Tifton: | 107.4 |
| Douglas: | 164.0 |
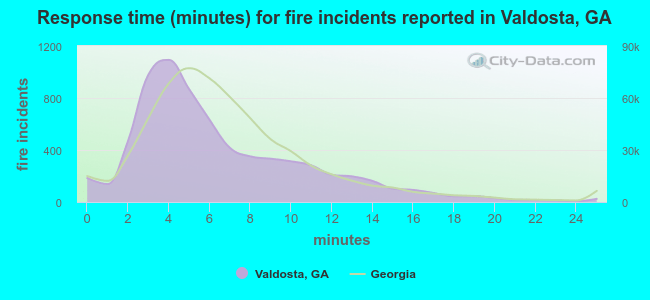 The median response time based on all reported fire incidents is 5 minutes. This is lower than the state median value.
The median response time in Valdosta, GA compared to nearest cities:
(Note: Based on data for all years, including only cities with at least 500 fire incidents)
| Valdosta: | 5 minutes |
| Hahira: | 7 minutes |
| Lake Park: | 8 minutes |
| Jennings: | 14 minutes |
| Adel: | 7 minutes |
| Nashville: | 6 minutes |
| Madison: | 8 minutes |
| Lee: | 11 minutes |
| Jasper: | 10 minutes |
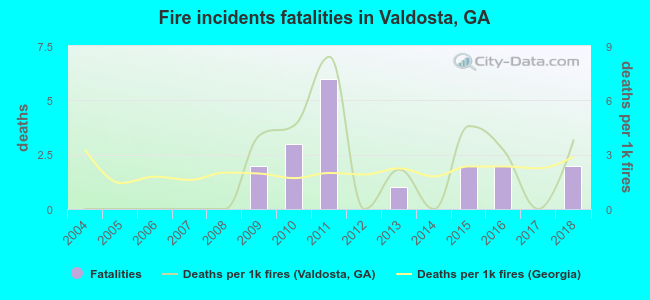 According to the data from the years 2004 - 2018 the average number of fire-related fatalities per year is 1. The highest number of deaths - 6 took place in 2011, and the lowest - 0 in 2004. The data has an increasing trend.
The average number of deaths per 1,000 fires is 2. This indicator was the highest - 8 in 2011, and the lowest 0 in 2004. The trend for deaths per 1,000 fire incidents is increasing. Compared to the state value the number of deaths per 1,000 incidents is similar.
According to the data from the years 2004 - 2018 the average number of fire-related fatalities per year is 1. The highest number of deaths - 6 took place in 2011, and the lowest - 0 in 2004. The data has an increasing trend.
The average number of deaths per 1,000 fires is 2. This indicator was the highest - 8 in 2011, and the lowest 0 in 2004. The trend for deaths per 1,000 fire incidents is increasing. Compared to the state value the number of deaths per 1,000 incidents is similar.
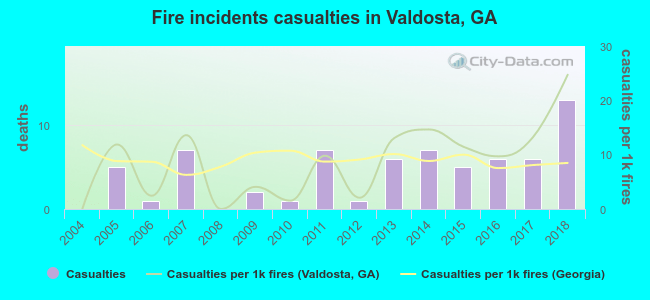 According to the data from the years 2004 - 2018 the average number of fire-related casualties per year is 4. The highest number of injuries - 13 took place in 2018, and the lowest - 0 in 2004. The data has an increasing trend.
The average number of casualties per 1,000 fires is 9. This indicator was the highest - 25 in 2018, and the lowest 0 in 2004. The trend for casualties per 1,000 incidents is growing. Compared to the state value the number of casualties per 1,000 fires is similar.
According to the data from the years 2004 - 2018 the average number of fire-related casualties per year is 4. The highest number of injuries - 13 took place in 2018, and the lowest - 0 in 2004. The data has an increasing trend.
The average number of casualties per 1,000 fires is 9. This indicator was the highest - 25 in 2018, and the lowest 0 in 2004. The trend for casualties per 1,000 incidents is growing. Compared to the state value the number of casualties per 1,000 fires is similar.
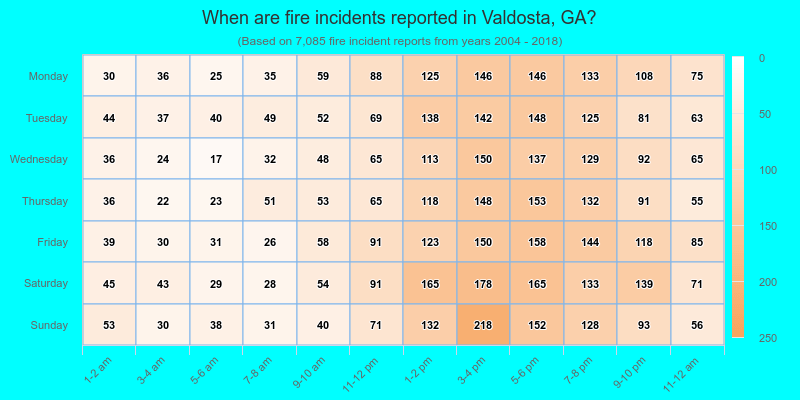
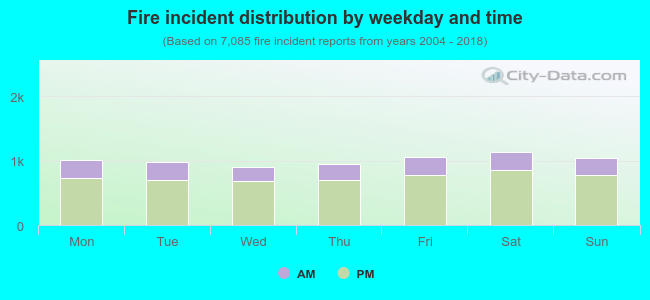 26.3% incidents where reported in the morning and 73.7% in the evening. The most fires (16.1%) took place on Saturday, and the least (12.8%) on Wednesday.
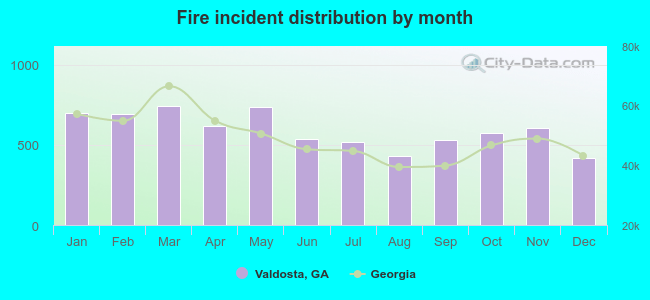 According to the 7,085 incident reports from years 2004 - 2018 most fires (10.5%) took place during March, and the least (5.9%) in December.
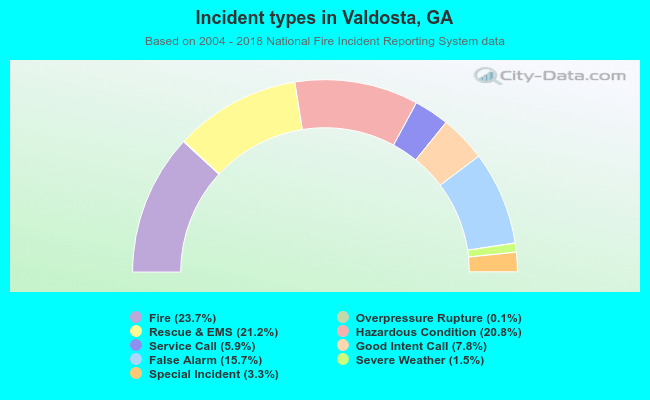 Out of all 29,876 cases reported during the years 2004 - 2018, the most belonged to the categories: Fire (23.7%), Rescue & EMS (21.2%), and Hazardous Condition (20.8%).
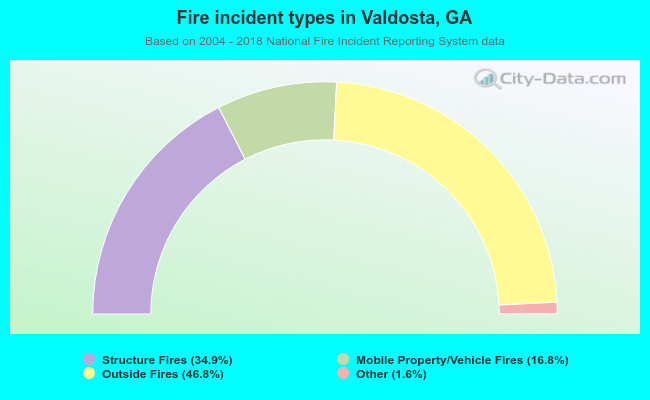 When looking into fire subcategories, the most reports belonged to: Outside Fires (46.8%), and Structure Fires (34.9%).