Valley Falls: Fire Incidents, Kansas (KS)
Where are fire incidents reported in Valley Falls, KS
Something went wrong! Please refresh the page.
|
| |||||||||||||||||||||||||||||||||||||||||||||||||||||||||||||||||||||||||||||||||||||||||||||||||||||||||||||
2002 - 2018 National Fire Incident Reporting System (NFIRS) incidents
- Incident types reported to NFIRS in Valley Falls, KS
- 44644.6%Fire
- 21421.4%Rescue & EMS
- 15115.1%Good Intent Call
- 10310.3%Hazardous Condition
- 434.3%Service Call
- 242.4%Severe Weather
- 161.6%False Alarm
- 30.3%Special Incident
- Fire incident types reported to NFIRS in Valley Falls, KS
- 23853.4%Outside Fires
- 14632.7%Structure Fires
- 378.3%Mobile Property/Vehicle Fires
- 255.6%Other
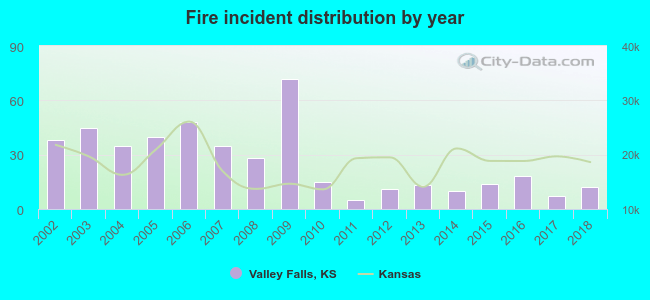 According to the data from the years 2002 - 2018 the average number of fire incidents per year is 26. The highest number of reported fire incidents - 72 took place in 2009, and the least - 5 in 2011. The data has a dropping trend.
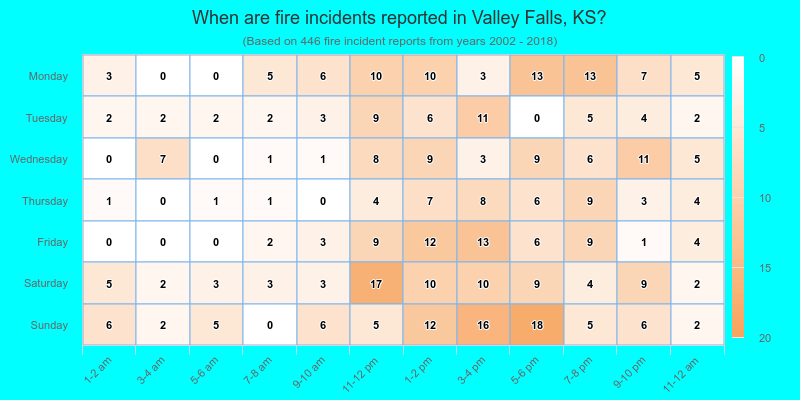
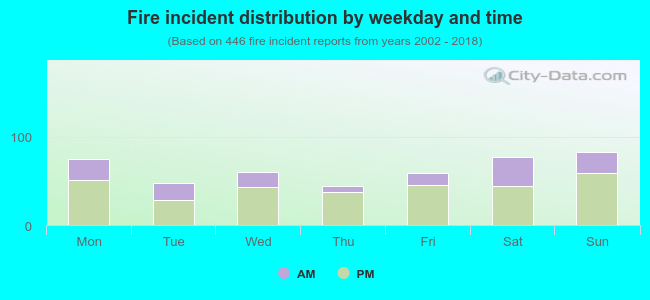 31.2% incidents where reported in the morning and 68.8% in the evening. The most fires (18.6%) took place on Sunday, and the least (9.9%) on Thursday.
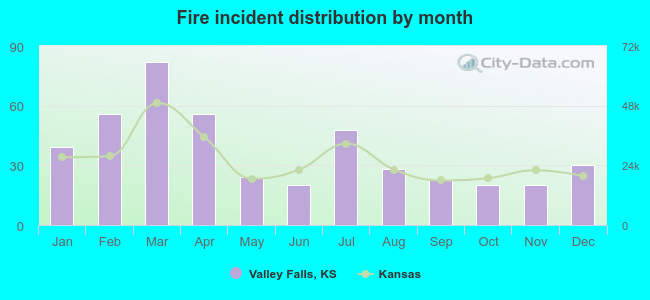 Based on the 446 reports from years 2002 - 2018 most fires (18.4%) took place during March, and the least (4.5%) in June.
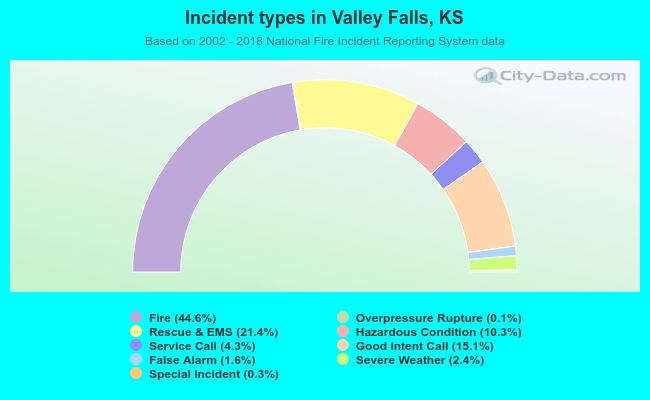 Out of all 1,001 cases reported during the years 2002 - 2018, the most belonged to the categories: Fire (44.6%), Rescue & EMS (21.4%), and Good Intent Call (15.1%).
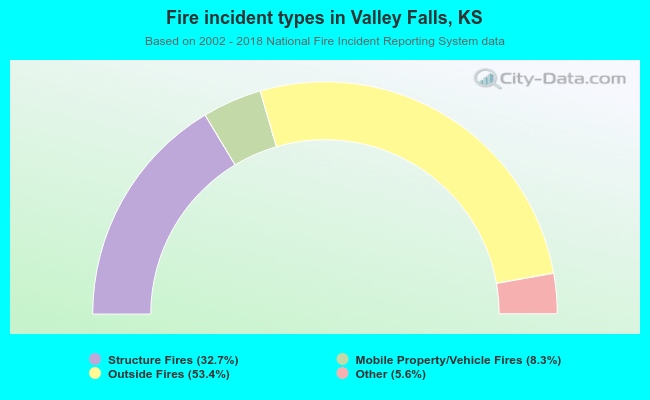 When looking into fire subcategories, the most incidents belonged to: Outside Fires (53.4%), and Structure Fires (32.7%).