Veedersburg: Fire Incidents, Indiana (IN)
Where are fire incidents reported in Veedersburg, IN
Something went wrong! Please refresh the page.
|
| |||||||||||||||||||||||||||||||||||||||||||||||||||||||||||||||||||||||||||||||||||||||||||||||||||||||||||||
| Other | 23 | |||||||||||||||||||||||||||||||||||||||||||||||||||||||||||||||||||||||||||||||||||||||||||||||||||||||||||||
2002 - 2017 National Fire Incident Reporting System (NFIRS) incidents
- Incident types reported to NFIRS in Veedersburg, IN
- 43348.9%Fire
- 17319.5%Hazardous Condition
- 13515.2%Rescue & EMS
- 586.5%Good Intent Call
- 394.4%False Alarm
- 232.6%Service Call
- 192.1%Special Incident
- 40.5%Overpressure Rupture
- 20.2%Severe Weather
- Fire incident types reported to NFIRS in Veedersburg, IN
- 16437.9%Structure Fires
- 13230.5%Outside Fires
- 8820.3%Mobile Property/Vehicle Fires
- 4911.3%Other
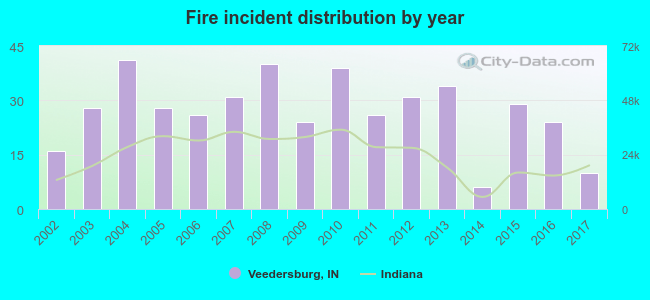 Based on the data from the years 2002 - 2017 the average number of fires per year is 27. The highest number of fires - 41 took place in 2004, and the least - 6 in 2014. The data has a dropping trend.
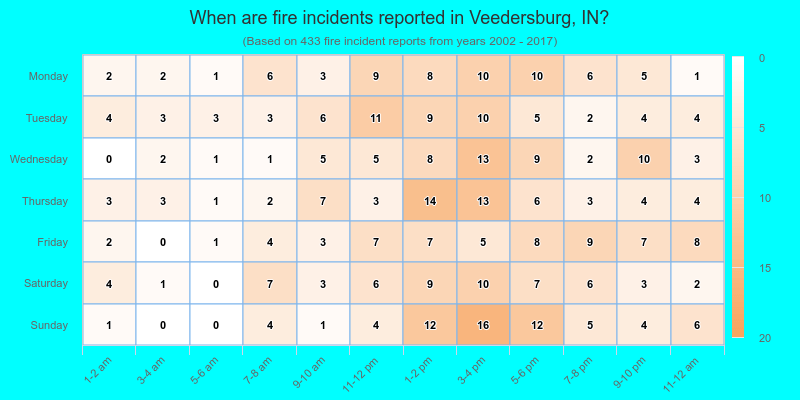
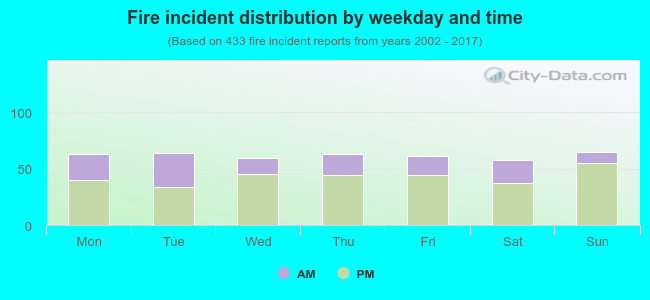 30.9% incidents where reported in the morning and 69.1% in the evening. The most fires (15.0%) took place on Sunday, and the least (13.4%) on Saturday.
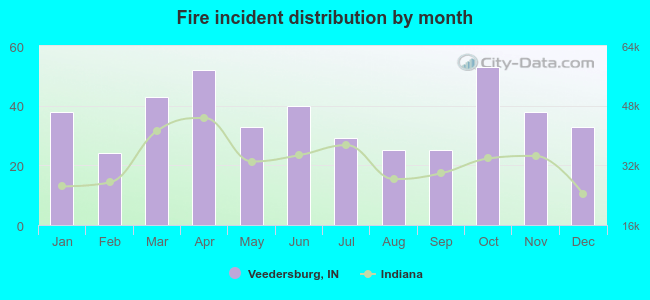 Based on the 433 incident reports from years 2002 - 2017 most fires (12.2%) took place during October, and the least (5.5%) in February.
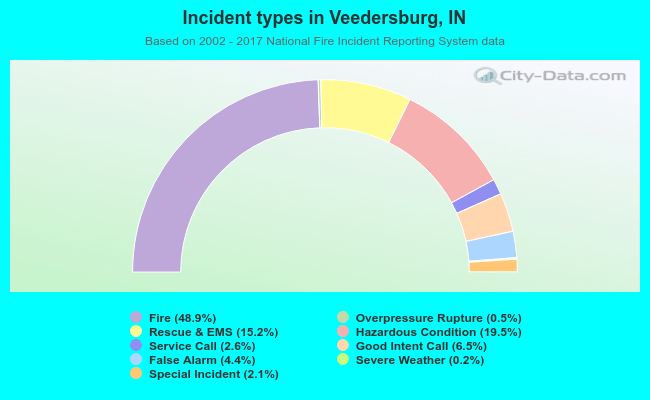 Out of all 886 cases reported during the years 2002 - 2017, the most belonged to the categories: Fire (48.9%), Hazardous Condition (19.5%), and Rescue & EMS (15.2%).
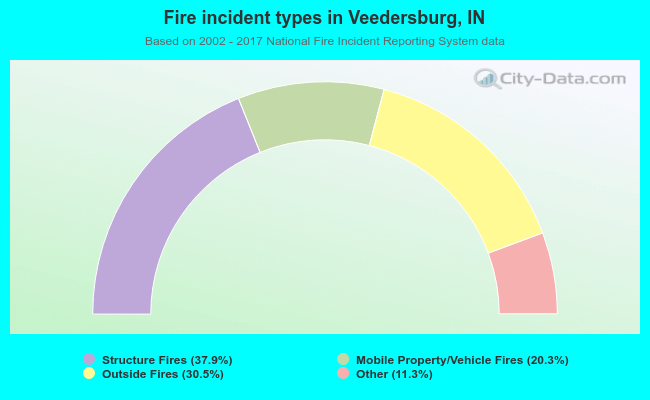 When looking into fire subcategories, the most incidents belonged to: Structure Fires (37.9%), and Outside Fires (30.5%).