| Fire incidents reported |
|---|
| Sreet name | Count |
|---|
| CR 59 | 8 | | NM 68 | 8 | | STATE ROAD 68 | 8 | | CR 57 | 6 | | COUNTY ROAD 41 | 4 | | COUNTY ROAD 51 | 4 | | CR 41 | 4 | | CR 435 | 4 | | CR 51 | 4 | | CR 58 HSE 159 | 4 | | CR 60 | 4 | | CR59A | 4 | | CTY RD 59A HSE 80 | 4 | | PD 1038 | 4 | | SR 68 | 4 | | 103 | 2 | | 11 CR60 | 2 | | 1326 SR 68 | 2 | | 68 CTY RD 59 | 2 | | 68 MM 12 PD 1069 A | 2 | | 786 CR 41 | 2 | | CNTY RD 39 # 16 | 2 | | CNTY RD 52 | 2 | | CNTY RD 57 MM 1 | 2 | | CNTY RD 59 PRIV DR 1083 HSE 51 | 2 |
| | | Fire incidents reported |
|---|
| Sreet name | Count |
|---|
| CNTY RD 59A PD 1083 HSE 34 | 2 | | CO RD 41 | 2 | | COUNTY RD 41 | 2 | | COUNTY RD 51 | 2 | | COUNTY RD 57 | 2 | | COUNTY RD 59 HSE 260 | 2 | | COUNTY RD 59 HSE 327 | 2 | | COUNTY RD 59A | 2 | | COUNTY ROAD 35 | 2 | | COUNTY ROAD 41 PD 1045 | 2 | | COUNTY ROAD 50 HOUSE 63 | 2 | | COUNTY ROAD 57 | 2 | | COUNTY ROAD 57 HOUSE 737 | 2 | | COUNTY ROAD 57 PRIVATE DRIVE 1 | 2 | | COUNTY ROAD 59 | 2 | | COUNTY ROAD 59 HOUSE 200 | 2 | | COUNTY ROAD 59 PD 1089 HOUSE 2 | 2 | | COUNTY ROAD 59-A HOUSE 16 | 2 | | COUNTY ROAD 59-A HOUSE 80 | 2 | | COUNTY ROAD 59A | 2 | | COUNTY ROAD 59A PRIVATE DRIVE | 2 | | COUNTY ROAD 60 | 2 | | COUNTYR RD 57 HOUSE 325 | 2 | | CR 0036 HSE 23 | 2 | | |
|
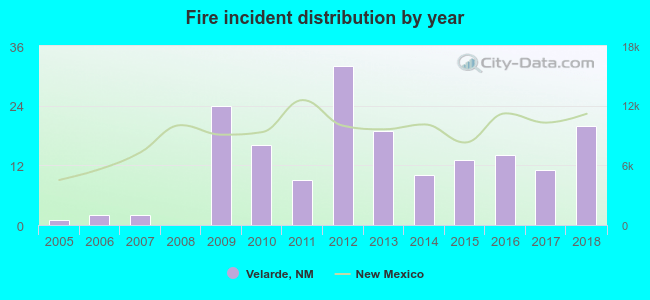 According to the data from the years 2005 - 2018 the average number of fires per year is 12. The highest number of reported fire incidents - 32 took place in 2012, and the least - 0 in 2008. The data has a rising trend.
 43.9% incidents where reported in the morning and 56.1% in the evening. The most fires (23.1%) took place on Saturday, and the least (6.9%) on Wednesday.
 According to the 173 fires from years 2005 - 2018 most fires (16.8%) took place during April, and the least (2.3%) in November.
 Out of all 364 cases reported during the years 2005 - 2018, the most belonged to the categories: Fire (47.5%), Rescue & EMS (37.6%), and Good Intent Call (8.5%).
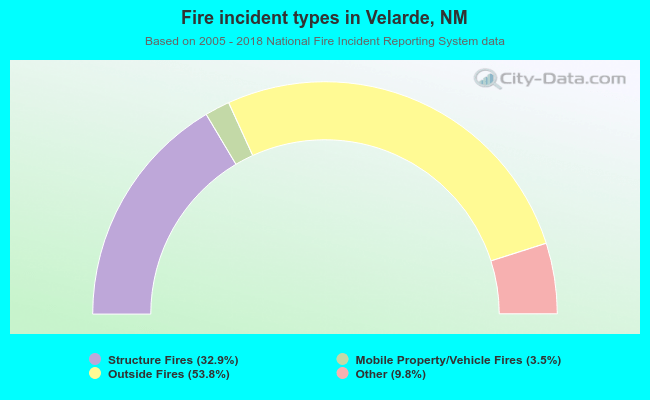 When looking into fire subcategories, the most incidents belonged to: Outside Fires (53.8%), and Structure Fires (32.9%).