Verona: Fire Incidents, Wisconsin (WI)
Where are fire incidents reported in Verona, WI
Something went wrong! Please refresh the page.
|
| |||||||||||||||||||||||||||||||||||||||||||||||||||||||||||||||||||||||||||||||||||||||||||||||||||||||||||||
2002 - 2018 National Fire Incident Reporting System (NFIRS) incidents
- Incident types reported to NFIRS in Verona, WI
- 2,03155.8%Rescue & EMS
- 44212.2%False Alarm
- 38710.6%Good Intent Call
- 3339.2%Fire
- 2857.8%Hazardous Condition
- 1353.7%Service Call
- 120.3%Severe Weather
- 90.2%Special Incident
- Fire incident types reported to NFIRS in Verona, WI
- 18455.3%Structure Fires
- 7723.1%Outside Fires
- 4814.4%Mobile Property/Vehicle Fires
- 247.2%Other
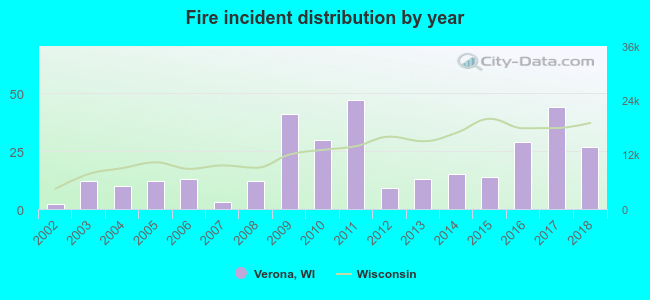 Based on the data from the years 2002 - 2018 the average number of fire incidents per year is 20. The highest number of reported fire incidents - 47 took place in 2011, and the least - 2 in 2002. The data has an increasing trend.
The average number of yearly fire incidents per 10k residents in Verona, WI compared to nearest cities:
(Note: Based on data for the last 3 years, including only cities with population 5,000 and above)
| Verona: | 27.8 |
| Fitchburg: | 33.1 |
| Middleton: | 24.1 |
| Oregon: | 24.0 |
| Madison: | 8.6 |
| Mount Horeb: | 17.6 |
| Monona: | 25.4 |
| McFarland: | 33.0 |
| Waunakee: | 17.1 |
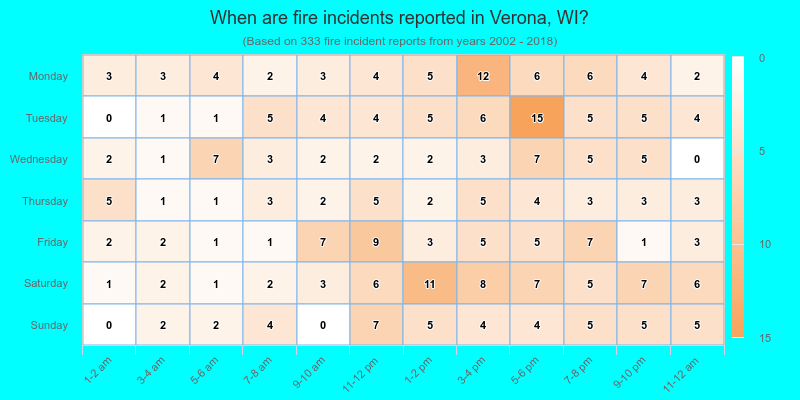
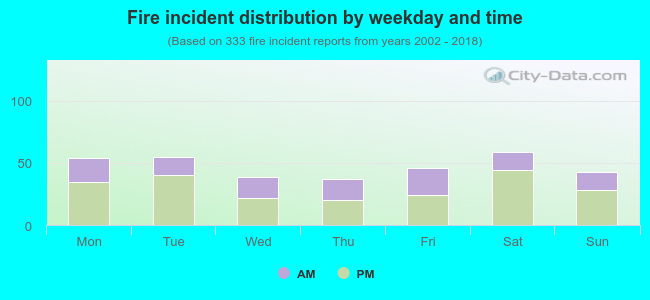 36.0% incidents where reported in the morning and 64.0% in the evening. The most fires (17.7%) took place on Saturday, and the least (11.1%) on Thursday.
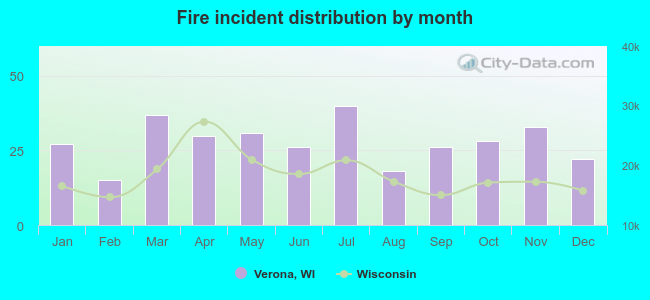 Based on the 333 fires from years 2002 - 2018 most fires (12.0%) took place during July, and the least (4.5%) in February.
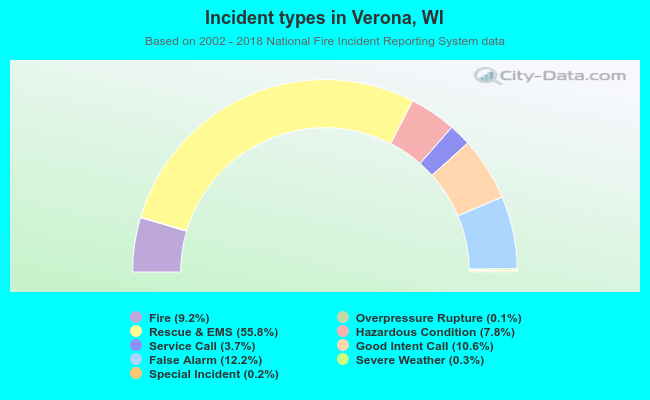 Out of all 3,637 cases reported during the years 2002 - 2018, the most belonged to the categories: Rescue & EMS (55.8%), False Alarm (12.2%), and Good Intent Call (10.6%).
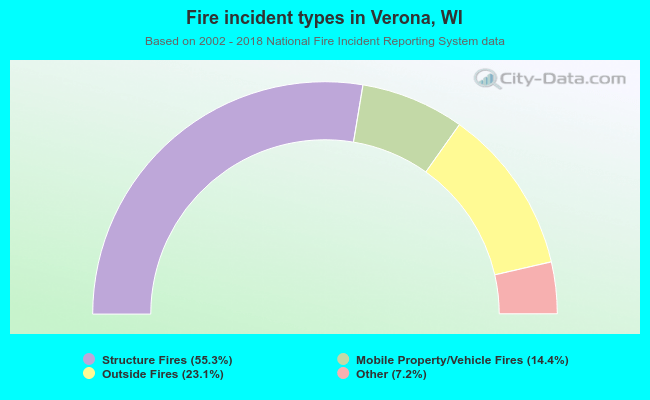 When looking into fire subcategories, the most incidents belonged to: Structure Fires (55.3%), and Outside Fires (23.1%).