Waimea: Fire Incidents, Hawaii (HI)
Where are fire incidents reported in Waimea, HI
Something went wrong! Please refresh the page.
|
| |||||||||||||||||||||||||||||||||||||||||||||||||||||||||||||||||||||||||||||||||||||||||||||||||||||||||||||
2003 - 2018 National Fire Incident Reporting System (NFIRS) incidents
- Incident types reported to NFIRS in Waimea, HI
- 60761.6%Rescue & EMS
- 18418.7%Fire
- 757.6%Good Intent Call
- 747.5%Service Call
- 242.4%Hazardous Condition
- 212.1%False Alarm
- 10.1%Special Incident
- Fire incident types reported to NFIRS in Waimea, HI
- 14478.3%Outside Fires
- 2212.0%Structure Fires
- 147.6%Mobile Property/Vehicle Fires
- 42.2%Other
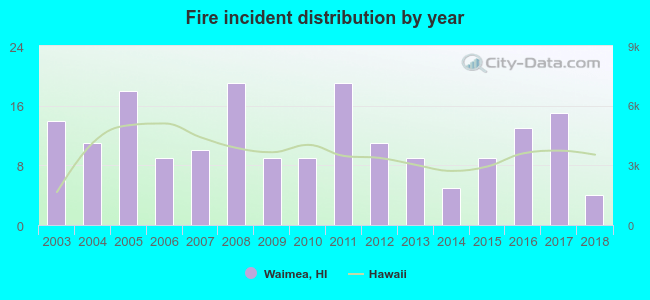 Based on the data from the years 2003 - 2018 the average number of fires per year is 12. The highest number of reported fires - 19 took place in 2008, and the least - 4 in 2018. The data has a dropping trend.
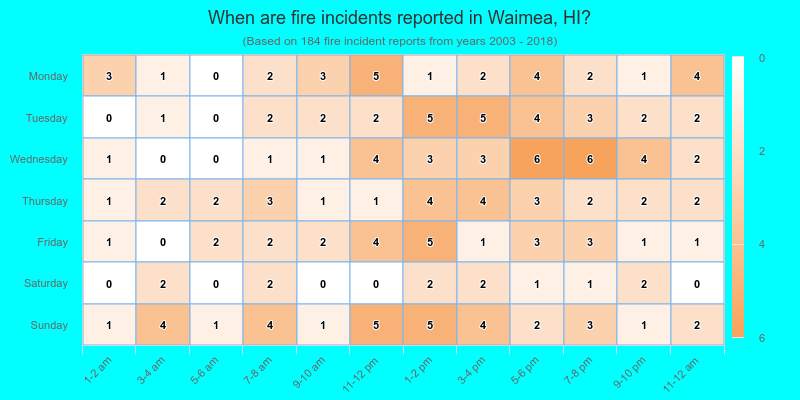
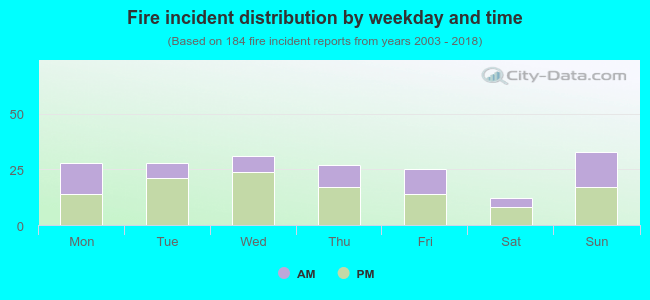 37.5% incidents where reported in the morning and 62.5% in the evening. The most fires (17.9%) took place on Sunday, and the least (6.5%) on Saturday.
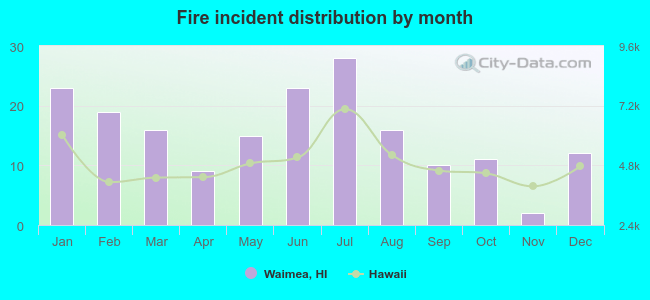 According to the 184 incident reports from years 2003 - 2018 most fires (15.2%) took place during July, and the least (1.1%) in November.
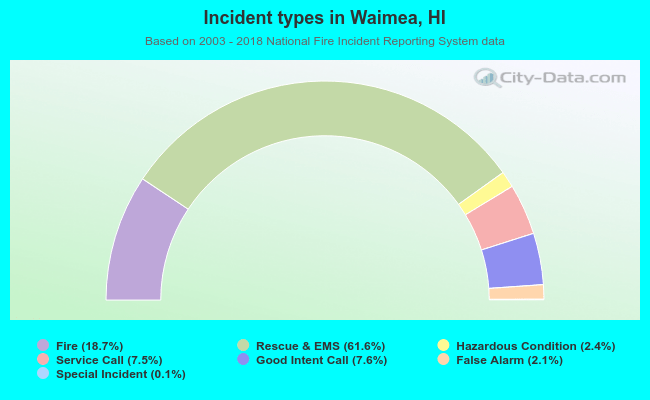 Out of all 986 cases reported during the years 2003 - 2018, the most belonged to the categories: Overpressure Rupture (61.6%), Fire (18.7%), and Service Call (7.6%).
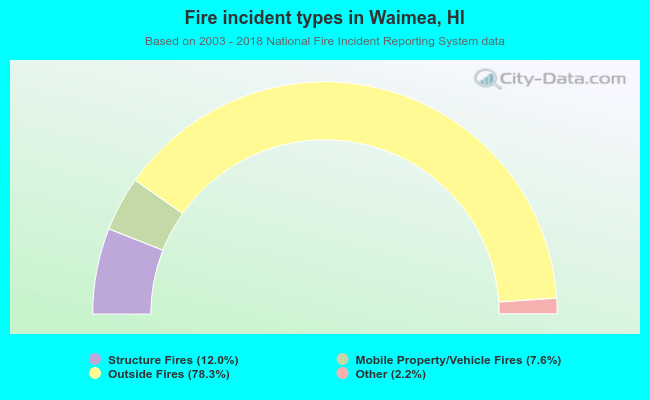 When looking into fire subcategories, the most incidents belonged to: Outside Fires (78.3%), and Structure Fires (12.0%).