| Fire incidents reported |
|---|
| Sreet name | Count |
|---|
| WALDO LANE | 16 | | WALDO LN | 12 | | 10 MAIN ST | 6 | | CHURCH ST | 6 | | HARTSBORO RD | 6 | | RT 140 WEST | 6 | | RT 7 SOUTH | 6 | | SUGAR HILL RD | 6 | | 1094 CHURCH STREET | 4 | | 1409 RT 7 SOUTH RT | 4 | | 331 CHURCH ST | 4 | | 38 HULL AVE | 4 | | 44 RIVER STREET | 4 | | CHURCH STREET | 4 | | DEPOT ST | 4 | | NORTH MAIN ST | 4 | | RAIL ROAD ST | 4 | | RAILROAD AVE. | 4 | | RAILROAD ST | 4 | | RAILROAD STREET | 4 | | RIVER ST | 4 | | ROUTE 7 SOUTH | 4 | | RT 140 EAST | 4 | | VT RT 7 | 4 | | WEST HILL RD | 4 |
| | | Fire incidents reported |
|---|
| Sreet name | Count |
|---|
| 10 MAIN STREET ST | 2 | | 105 NORTHEND DRIVE | 2 | | 110 CHURCH ST | 2 | | 110 CHURCH STREET | 2 | | 111 ELM STREET | 2 | | 1121 RT 7 SOUTH | 2 | | 113 NORTH MAIN | 2 | | 117 PROSPECT STREET | 2 | | 1202 CHURCH STREET | 2 | | 1221 ROUTE 7 SOUTH | 2 | | 126 MEACHAM ST ST | 2 | | 126 SCHOOL STREET ST | 2 | | 129 MEACHAM ST ST | 2 | | 1374 RT 7 SOUTH RT | 2 | | 140 EAST AND WEST HILL | 2 | | 140 WEST | 2 | | 140W | 2 | | 144 SCHOOL ST. | 2 | | 144 SCHOOL STREET | 2 | | 1475 WALLINGFORD POND ROAD | 2 | | 164 NORTH MAIN STREET | 2 | | 166 HILL SIDE ROAD | 2 | | 1688 WEST HILL RD | 2 | | 17 DEPOT ST | 2 | | 17 RAILROAD ST RD | 2 |
|
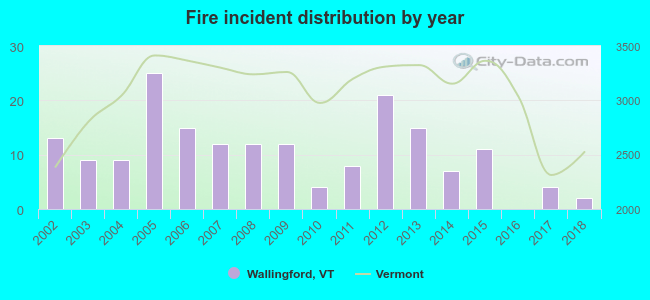 According to the data from the years 2002 - 2018 the average number of fires per year is 11. The highest number of fire incidents - 25 took place in 2005, and the least - 0 in 2016. The data has a dropping trend.
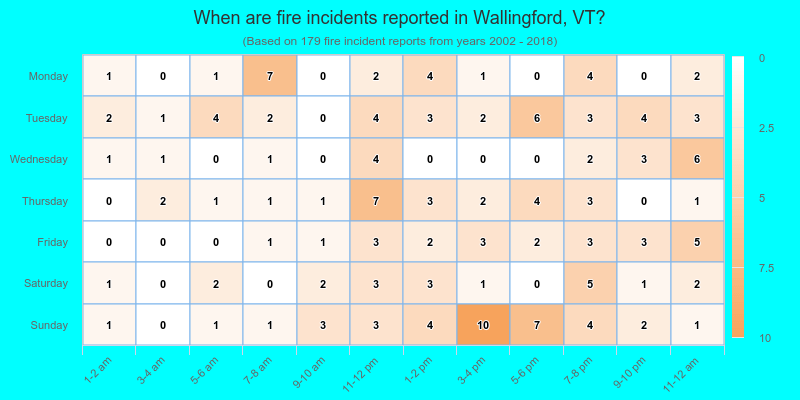
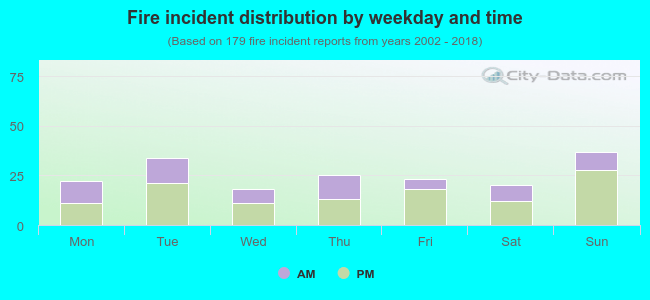 36.3% incidents where reported in the morning and 63.7% in the evening. The most fires (20.7%) took place on Sunday, and the least (10.1%) on Wednesday.
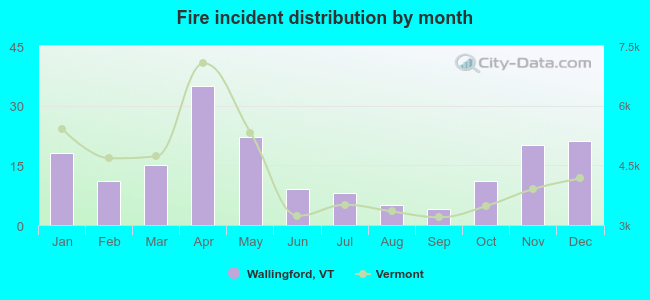 Based on the 179 fire incident reports from years 2002 - 2018 most fires (19.6%) took place during April, and the least (2.2%) in September.
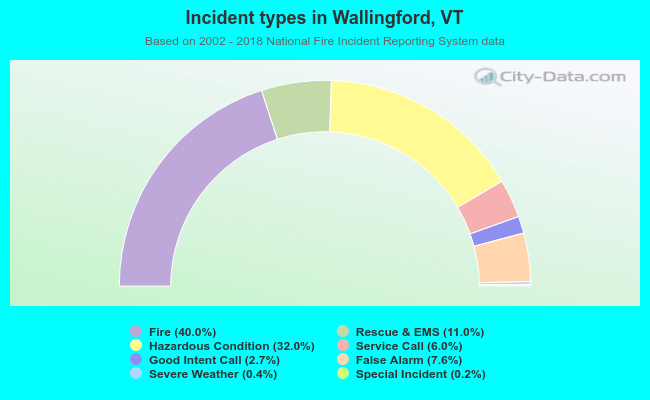 Out of all 447 cases reported during the years 2002 - 2018, the most belonged to the categories: Fire (40.0%), Rescue & EMS (32.0%), and Overpressure Rupture (11.0%).
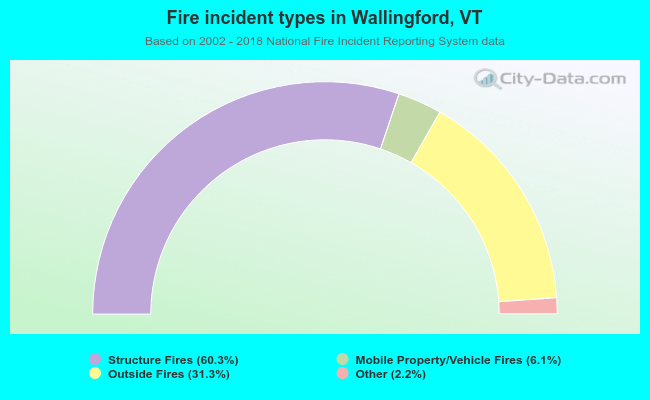 When looking into fire subcategories, the most incidents belonged to: Structure Fires (60.3%), and Outside Fires (31.3%).