Wallis: Fire Incidents, Texas (TX)
Where are fire incidents reported in Wallis, TX
Something went wrong! Please refresh the page.
|
| |||||||||||||||||||||||||||||||||||||||||||||||||||||||||||||||||||||||||||||||||||||||||||||||||||||||||||||
| Other | 40 | |||||||||||||||||||||||||||||||||||||||||||||||||||||||||||||||||||||||||||||||||||||||||||||||||||||||||||||
2002 - 2018 National Fire Incident Reporting System (NFIRS) incidents
- Incident types reported to NFIRS in Wallis, TX
- 20443.7%Fire
- 10221.8%Rescue & EMS
- 7816.7%Good Intent Call
- 5211.1%Hazardous Condition
- 255.4%False Alarm
- 40.9%Service Call
- 20.4%Special Incident
- Fire incident types reported to NFIRS in Wallis, TX
- 10652.0%Outside Fires
- 7838.2%Structure Fires
- 167.8%Mobile Property/Vehicle Fires
- 42.0%Other
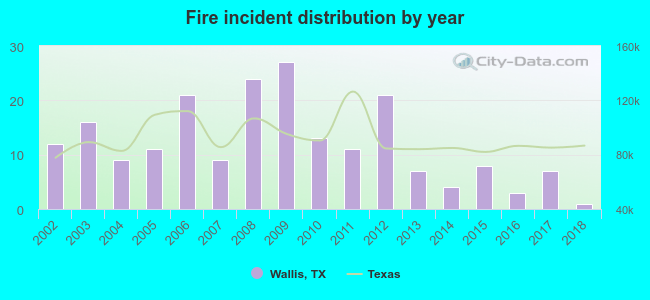 Based on the data from the years 2002 - 2018 the average number of fires per year is 12. The highest number of reported fire incidents - 27 took place in 2009, and the least - 1 in 2018. The data has a declining trend.
 According to the data from the years 2002 - 2018 the average number of fire-related yearly casualties is 0. The highest number of casualties - 1 took place in 2007, and the lowest - 0 in 2002. The data has a constant trend.
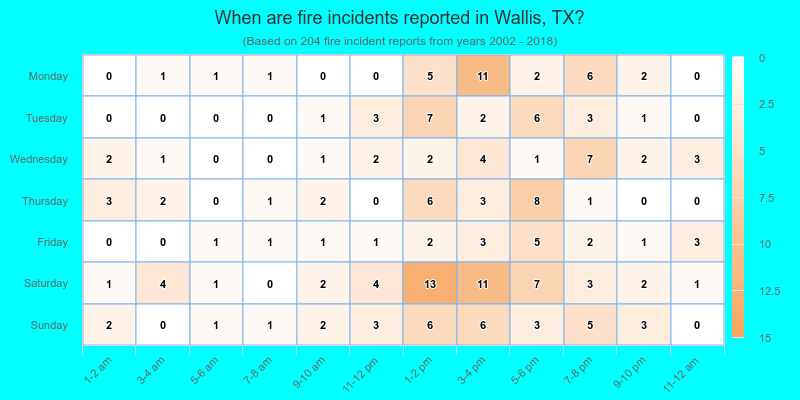
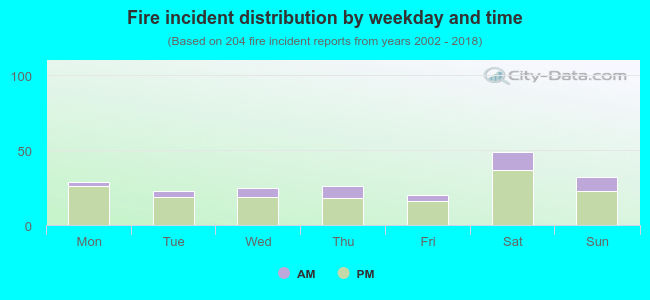 22.5% incidents where reported in the morning and 77.5% in the evening. The most fires (24.0%) took place on Saturday, and the least (9.8%) on Friday.
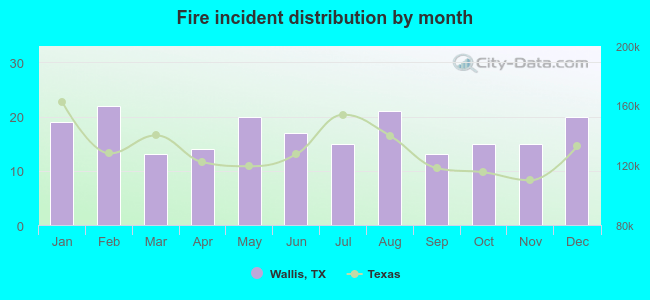 According to the 204 fire incidents from years 2002 - 2018 most fires (10.8%) took place during February, and the least (6.4%) in March.
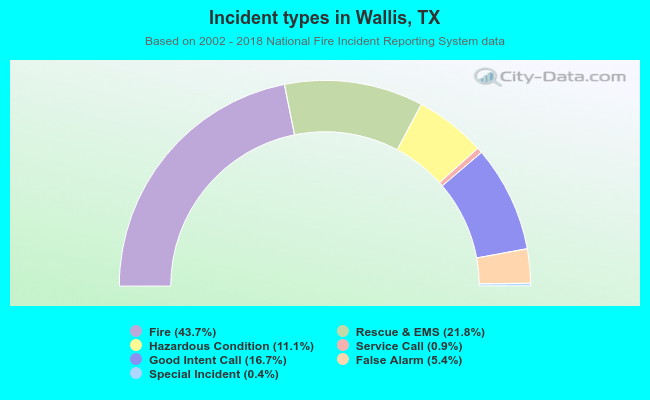 Out of all 467 cases reported during the years 2002 - 2018, the most belonged to the categories: Fire (43.7%), Overpressure Rupture (21.8%), and Service Call (16.7%).
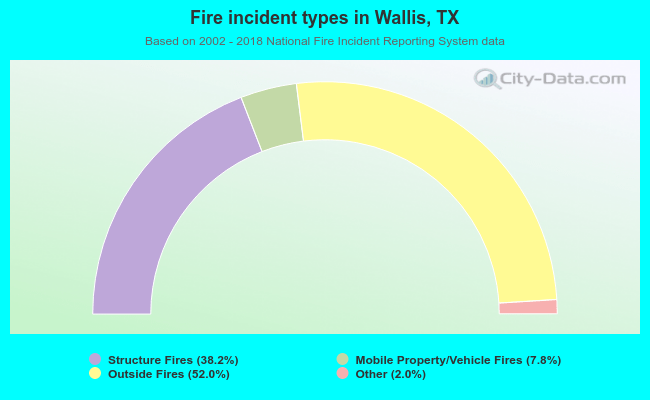 When looking into fire subcategories, the most incidents belonged to: Outside Fires (52.0%), and Structure Fires (38.2%).