| Fire incidents reported |
|---|
| Sreet name | Count |
|---|
| TOPEKA LN | 10 | | IL HWY 148 | 8 | | CHERRYVILLE LN | 6 | | TOPEKA | 6 | | BAKERVILLE RD | 4 | | BONNIE | 4 | | CARTEL LN | 4 | | CASCADE LN | 4 | | IL HWY 148 HWY | 4 | | KNOB ST | 4 | | LODGE LN | 4 | | RIDDLE LN | 4 | | SPRUCE LN | 4 | | 1000 W BLAKELY ST | 2 | | 148 | 2 | | 148 EAST TO KNOB | 2 | | 148 SOUTH | 2 | | 305 S. HIRONS ST | 2 | | 358 N SPRUCE | 2 | | 3810 E BAKEVILLE | 2 | | 3856 N. SPRUCE LN | 2 | | 3866 N. SPRUCE LN | 2 | | 4591 N SPRUCE LN | 2 | | 502 STEWART AVE | 2 | | 5325 E VASSAR RD | 2 |
| | | Fire incidents reported |
|---|
| Sreet name | Count |
|---|
| 6444 N RIDDLE LN | 2 | | 6444 RIDDLE LN RD | 2 | | 7754 N. SALISBURY LN | 2 | | 802 W KNOB | 2 | | 804 WEST KNOB ST | 2 | | BAKERVILLE | 2 | | BAKERVILLE RD | 2 | | BONNIE LN | 2 | | BONNIE RD | 2 | | BONNIE RD | 2 | | BROADWAY | 2 | | BROWN LN | 2 | | CASPER RD | 2 | | CASPER RD | 2 | | CASPER RD. | 2 | | CHERRYVILLE | 2 | | CHESTNUT LANE | 2 | | CIRCLE DR | 2 | | COLE ST | 2 | | DAVIS AND SPURCE | 2 | | DUBOIS RD | 2 | | E CASPER RD | 2 | | E DAVIS RD | 2 | | E DUBOIS RD | 2 | | E FLAG RD | 2 |
|
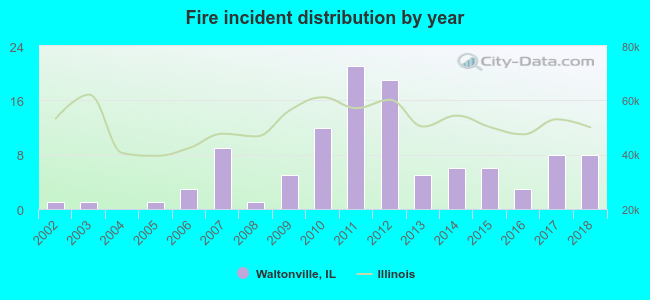 According to the data from the years 2002 - 2018 the average number of fires per year is 6. The highest number of reported fires - 21 took place in 2011, and the least - 0 in 2004. The data has a growing trend.
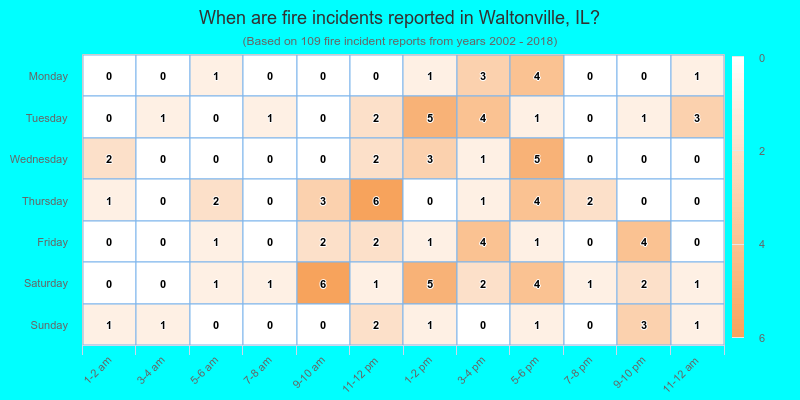
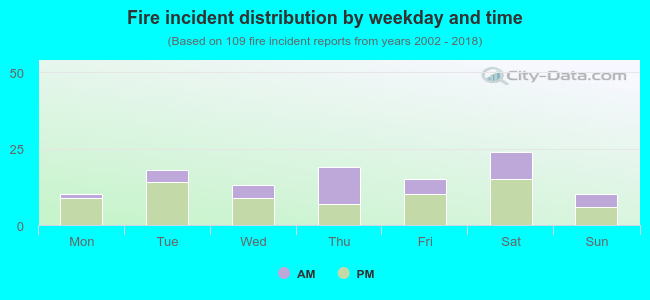 35.8% incidents where reported in the morning and 64.2% in the evening. The most fires (22.0%) took place on Saturday, and the least (9.2%) on Monday.
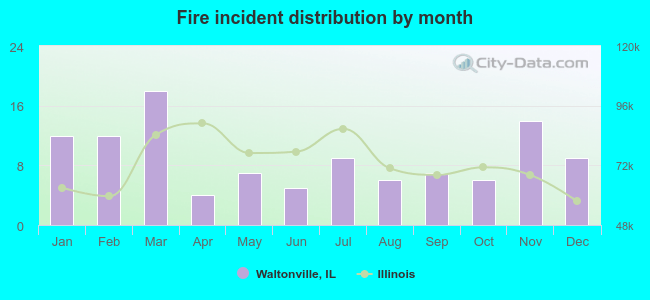 According to the 109 reports from years 2002 - 2018 most fires (16.5%) took place during March, and the least (3.7%) in April.
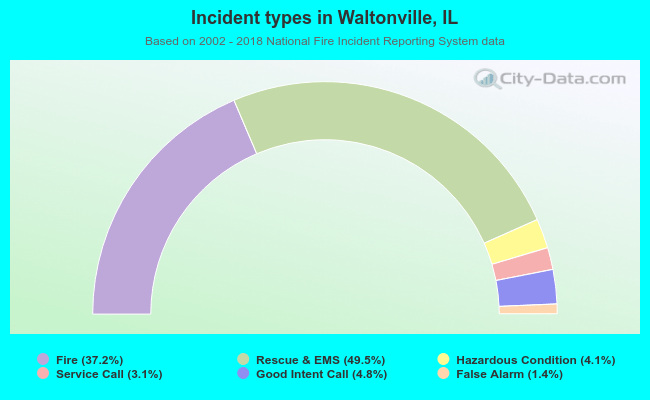 Out of all 293 cases reported during the years 2002 - 2018, the most belonged to the categories: Overpressure Rupture (49.5%), Fire (37.2%), and Service Call (4.8%).
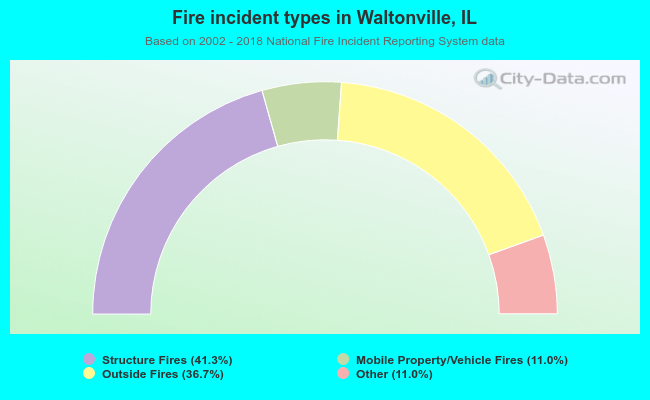 When looking into fire subcategories, the most reports belonged to: Structure Fires (41.3%), and Outside Fires (36.7%).