| Fire incidents reported |
|---|
| Sreet name | Count |
|---|
| MAIN ST ST | 22 | | SCHROON RIVER RD RD | 22 | | RIVER ST ST | 18 | | SWEET RD | 18 | | ALDEN AVE AVE | 16 | | GOLF COURSE RD | 16 | | GOLF COURSE RD RD | 16 | | SWEET ROAD | 16 | | RIVER STREET | 14 | | STATE ROUTE 9 RT | 14 | | LIBRARY AVE AVE | 12 | | MAIN ST | 12 | | SCHROON RIVER RD | 12 | | ST RT 28 RT | 12 | | STATE ROUTE 9 | 12 | | SWEET ROAD RD | 12 | | EAST SCHROON RIVER ROAD RD | 10 | | I-87 SOUTHBOUND HWY | 10 | | RAYMOND LN | 10 | | RIVER ST | 10 | | EAST SCHROON RIVER RD RD | 8 | | GOLF COURSE ROAD RD | 8 | | I-87 NORTHBOUND HWY | 8 | | LIBRARY AVE | 8 | | MAIN STREET ST | 8 |
| | | Fire incidents reported |
|---|
| Sreet name | Count |
|---|
| RIDGE AVE AVE | 8 | | RIVER STREET ST | 8 | | STATE ROUTE 28 | 8 | | STATE ROUTE 28 RT | 8 | | SWEET RD RD | 8 | | FOREST LAKE ROAD | 6 | | FOREST LAKE ROAD RD | 6 | | HARRINGTON HILL ROAD | 6 | | KING ST ST | 6 | | KING STREET | 6 | | OAK STREET | 6 | | PLANTY DR DR | 6 | | ROUTE 9 RT | 6 | | ST RT 9 RT | 6 | | THIRD AVE AVE | 6 | | WARREN ST ST | 6 | | 278 SCHROON RIVER RD | 4 | | BURDICK AVE | 4 | | CANADA STREET ST | 4 | | DIAMOND POINT MOUNTAIN RD RD | 4 | | DIAMOND POINT ROAD RD | 4 | | ECHO LAKE RD | 4 | | ECHO LN LN | 4 | | ELM STREET ST | 4 | | EMERSON AVE AVE | 4 |
|
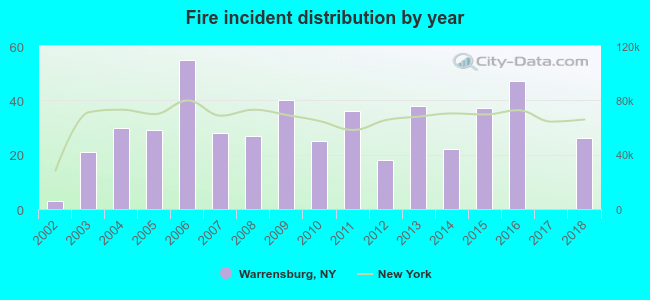 Based on the data from the years 2002 - 2018 the average number of fire incidents per year is 28. The highest number of fire incidents - 55 took place in 2006, and the least - 0 in 2017. The data has a rising trend.
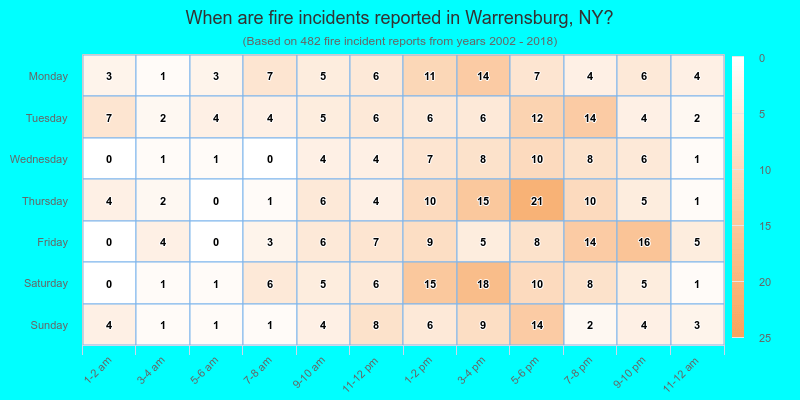
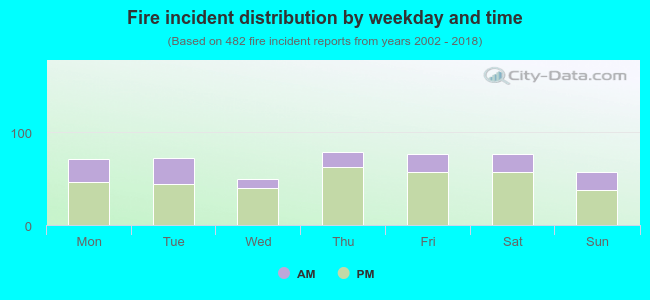 28.6% incidents where reported in the morning and 71.4% in the evening. The most fires (16.4%) took place on Thursday, and the least (10.4%) on Wednesday.
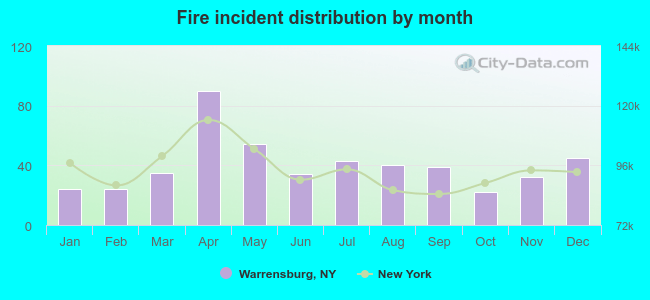 According to the 482 fire incident reports from years 2002 - 2018 most fires (18.7%) took place during April, and the least (4.6%) in October.
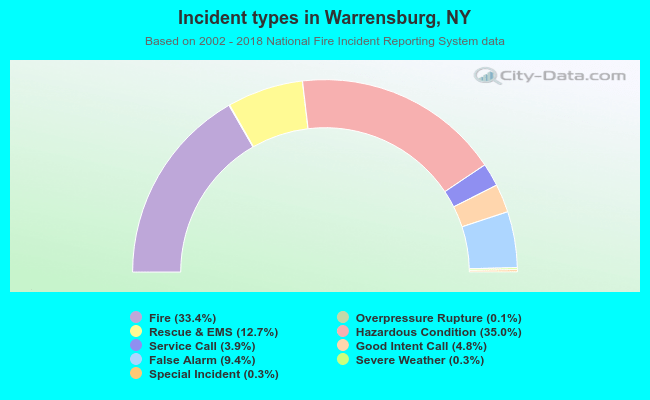 Out of all 1,444 cases reported during the years 2002 - 2018, the most belonged to the categories: Hazardous Condition (35.0%), Fire (33.4%), and Rescue & EMS (12.7%).
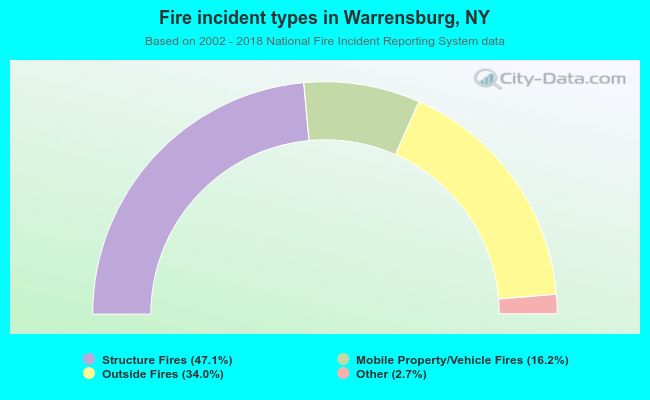 When looking into fire subcategories, the most incidents belonged to: Structure Fires (47.1%), and Outside Fires (34.0%).