| Fire incidents reported |
|---|
| Sreet name | Count |
|---|
| ALLAMAKEE ST ST | 28 | | X-16 FOREST MILLS ROAD HWY | 24 | | PICNIC WOODS DRIVE DR | 18 | | HEDLEY DRIVE DR | 16 | | HWY 9 EAST HWY | 16 | | MAIN ST | 12 | | ROSSVILLE ROAD RD | 12 | | X-16 FOREST MILLS ROAD HWY | 12 | | 9TH ST SW ST | 10 | | A-52 ELON DRIVE HWY | 10 | | HIGHWAY 76 | 10 | | HWY 9 WEST HWY | 10 | | POLE LINE ROAD HWY | 10 | | X-20 LYCURGUS ROAD HWY | 10 | | HWY 76 NORTH HWY | 8 | | HWY 76 SOUTH HWY | 8 | | IRON MINE DRIVE DR | 8 | | MAUD ROAD RD | 8 | | PARK ROAD RD | 8 | | WEST RIDGE DRIVE DR | 8 | | 11 AVE SW | 6 | | 2ND AVE | 6 | | 2ND AVE NW AVE | 6 | | 3RD AVE NW AVE | 6 | | A-52 OLD HWY 9 HWY | 6 |
| | | Fire incidents reported |
|---|
| Sreet name | Count |
|---|
| EAST MAIN ST ST | 6 | | HWY 51 SOUTH HWY | 6 | | MAKEE DR | 6 | | MAKEE DRIVE DR | 6 | | MAUD RD | 6 | | NORTH LINE DRIVE DR | 6 | | O'NEIL RIDGE ROAD RD | 6 | | PRAIRIE AVE NW AVE | 6 | | X-20 LYCURGUS ROAD HWY | 6 | | 2ND ST | 4 | | 2ND ST NW ST | 4 | | 3 RD ST NW | 4 | | 3RD AVE | 4 | | 4TH ST | 4 | | 4TH ST NW ST | 4 | | 9TH ST | 4 | | AUTUMN ROAD RD | 4 | | BAKKUM ROAD RD | 4 | | BETHLEHEM DRIVE DR | 4 | | BIG FOOT ROAD | 4 | | BUFFALO ROAD RD | 4 | | CLONKITTY ROAD RD | 4 | | COOKS RD | 4 | | COUNTRYSIDE DR | 4 | | |
|
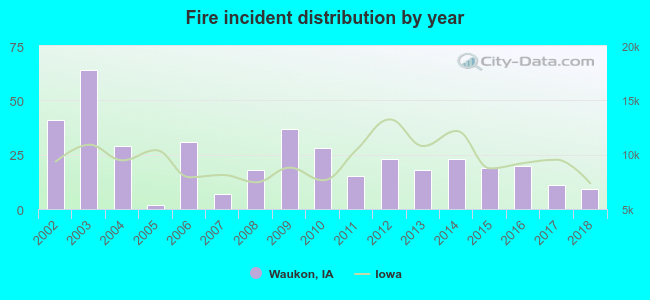 According to the data from the years 2002 - 2018 the average number of fire incidents per year is 23. The highest number of reported fire incidents - 64 took place in 2003, and the least - 2 in 2005. The data has a dropping trend.
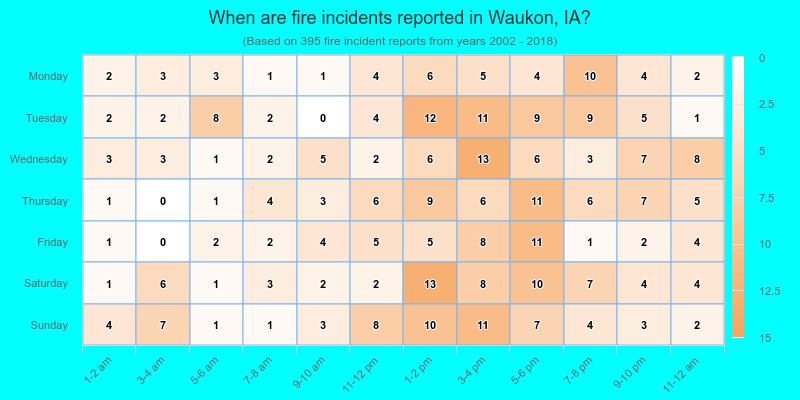
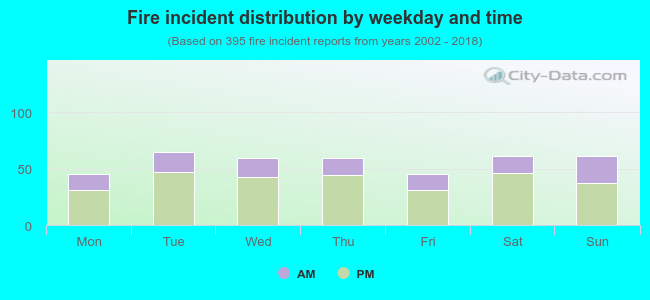 29.4% incidents where reported in the morning and 70.6% in the evening. The most fires (16.5%) took place on Tuesday, and the least (11.4%) on Monday.
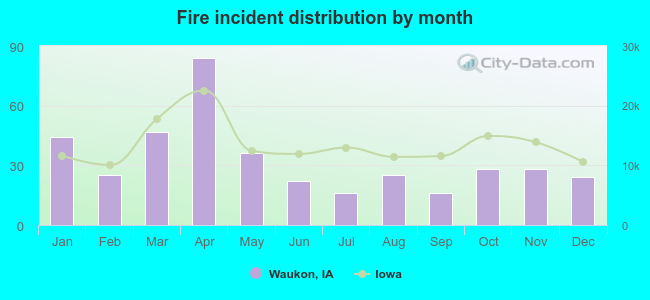 Based on the 395 fire incidents from years 2002 - 2018 most fires (21.3%) took place during April, and the least (4.1%) in July.
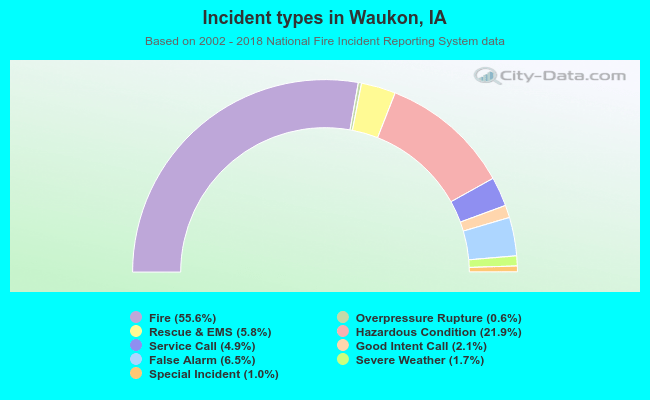 Out of all 711 cases reported during the years 2002 - 2018, the most belonged to the categories: Fire (55.6%), Hazardous Condition (21.9%), and False Alarm (6.5%).
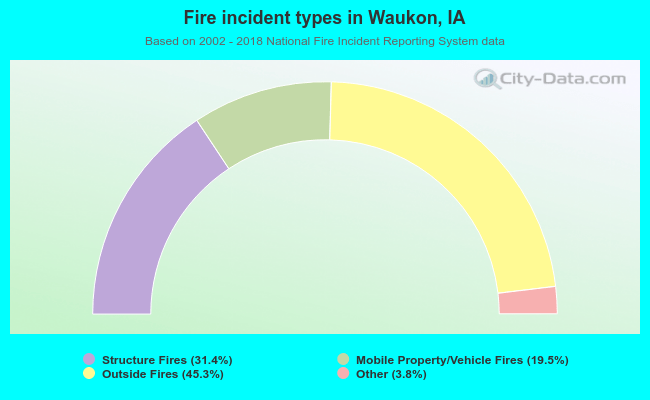 When looking into fire subcategories, the most incidents belonged to: Outside Fires (45.3%), and Structure Fires (31.4%).