Waverly: Fire Incidents, Nebraska (NE)
Where are fire incidents reported in Waverly, NE
Something went wrong! Please refresh the page.
|
| |||||||||||||||||||||||||||||||||||||||||||||||||||||||||||||||||||||||||||||||||||||||||||||||||||||||||||||
2002 - 2018 National Fire Incident Reporting System (NFIRS) incidents
- Incident types reported to NFIRS in Waverly, NE
- 96952.3%Rescue & EMS
- 46825.2%Fire
- 1377.4%False Alarm
- 1176.3%Hazardous Condition
- 1005.4%Good Intent Call
- 512.8%Service Call
- 60.3%Special Incident
- 50.3%Severe Weather
- Fire incident types reported to NFIRS in Waverly, NE
- 25153.6%Outside Fires
- 11825.2%Mobile Property/Vehicle Fires
- 8117.3%Structure Fires
- 183.8%Other
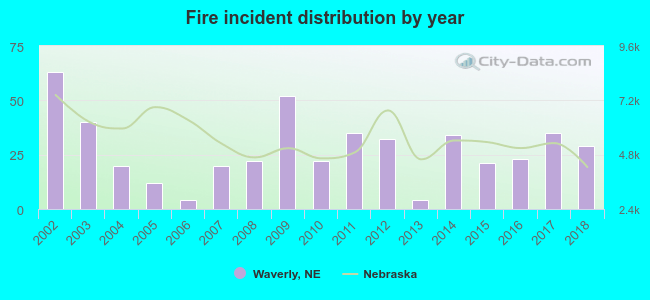 According to the data from the years 2002 - 2018 the average number of fires per year is 28. The highest number of fire incidents - 63 took place in 2002, and the least - 4 in 2006. The data has a declining trend.
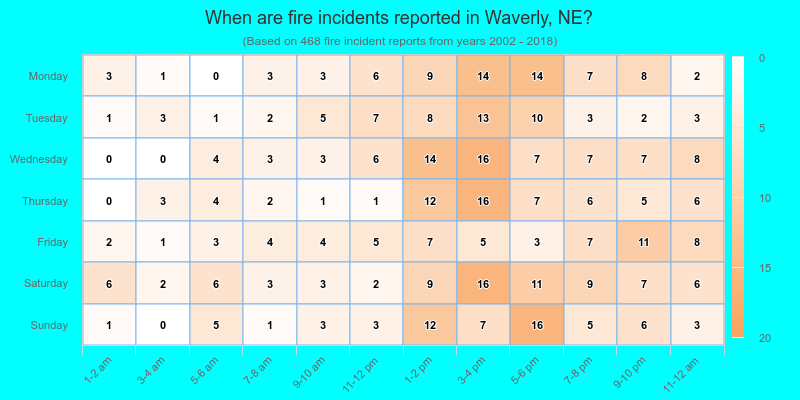
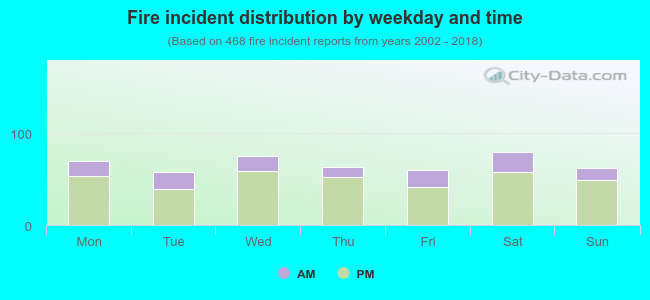 24.8% incidents where reported in the morning and 75.2% in the evening. The most fires (17.1%) took place on Saturday, and the least (12.4%) on Tuesday.
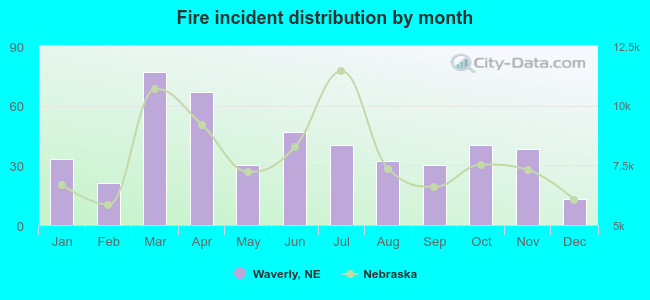 According to the 468 fire incidents from years 2002 - 2018 most fires (16.5%) took place during March, and the least (2.8%) in December.
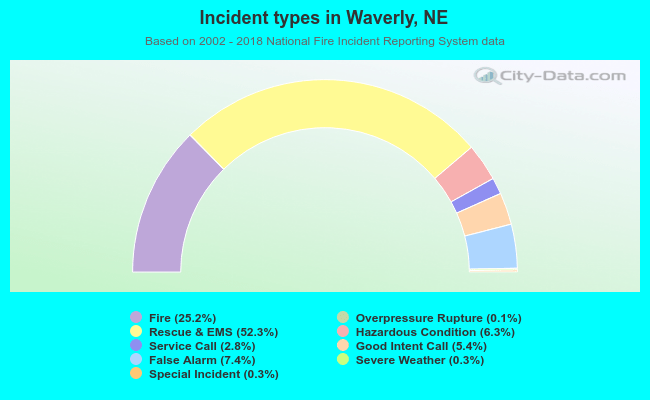 Out of all 1,854 cases reported during the years 2002 - 2018, the most belonged to the categories: Rescue & EMS (52.3%), Fire (25.2%), and False Alarm (7.4%).
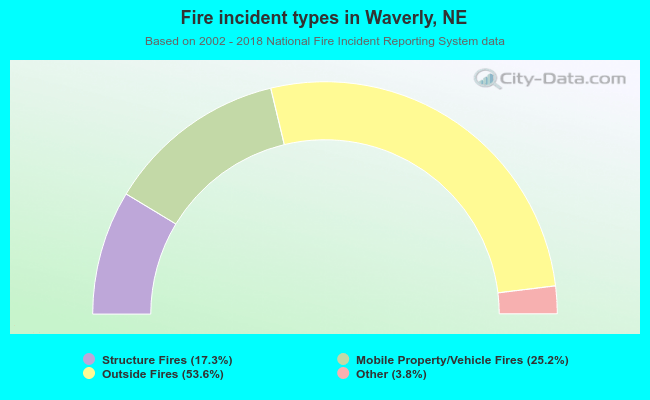 When looking into fire subcategories, the most reports belonged to: Outside Fires (53.6%), and Mobile Property/Vehicle Fires (25.2%).