| Fire incidents reported |
|---|
| Sreet name | Count |
|---|
| HWY 281 | 20 | | HWY 14 | 14 | | HWY412 CORD219 | 10 | | COUNTY ROAD 480 | 8 | | HWY 412 | 8 | | 1000 ASH ST | 6 | | 15 WEST ON BELVA BLACKTOP | 6 | | CHURCH ST | 6 | | CO RD 400 | 6 | | 1 S OF AVARD | 4 | | 1 SOUTH OF WAYNOKA ON 281 | 4 | | 10379 CO RD 460 | 4 | | 281 HWY | 4 | | 2WEST OF BOUSE JCT AND 12 S | 4 | | 420 BRYAN | 4 | | ALINE RD | 4 | | BELVA BLACKTOP | 4 | | BROADWAY | 4 | | BROADWAY ST | 4 | | CEDAR ST | 4 | | HWY412HWY281 | 4 | | LINCOLN ST | 4 | | LITTLE SAHARA STATE PARK | 4 | | MAIN ST | 4 | | MURROW | 4 |
| | | Fire incidents reported |
|---|
| Sreet name | Count |
|---|
| NORTH CAMPGROUND RD | 4 | | .5 SOUTH ON U.S. HWY 281 | 2 | | 1 MILE NORTH OF 220EW 32 NORT | 2 | | 1/2 E CITY SHOP | 2 | | 100 MAIN ST. | 2 | | 101 MAIN | 2 | | 1227 NICKERSON ST | 2 | | 1277 NICKERSON ST | 2 | | 1279 CHURCH | 2 | | 1358 BROADWAY | 2 | | 1363 LINCOLN ST | 2 | | 14 AND DEWEY | 2 | | 14 HWY | 2 | | 14 WEST OF WAYNOKA | 2 | | 1433 MISSOURI ST | 2 | | 14649 HWY 14 | 2 | | 1472 ELM | 2 | | 14N ON HWY 14 E SIDE OFROAD | 2 | | 15 SOUTH OF WAYNOKA ON 281 | 2 | | 1500 BLK OF ELM ST | 2 | | 1520 MAIN | 2 | | 1585 PARK ST | 2 | | 1585 PARK STREET | 2 | | 16 MILE SOUTH OF SEILING | 2 | | |
|
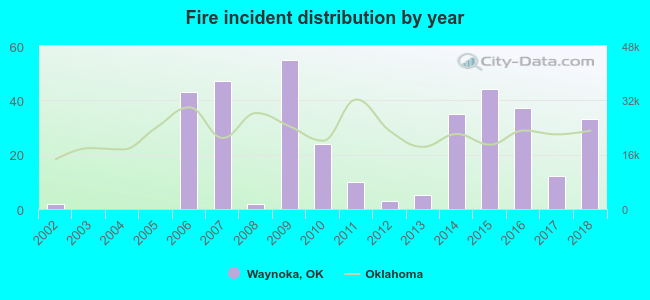 Based on the data from the years 2002 - 2018 the average number of fire incidents per year is 21. The highest number of reported fire incidents - 55 took place in 2009, and the least - 0 in 2003. The data has a growing trend.
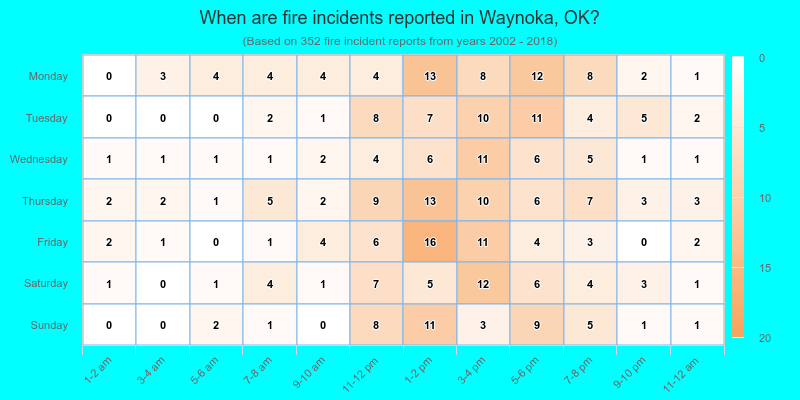
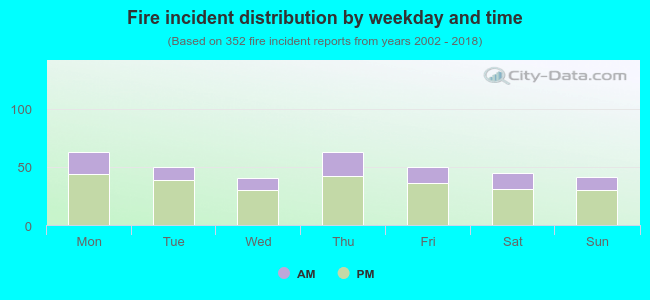 28.4% incidents where reported in the morning and 71.6% in the evening. The most fires (17.9%) took place on Monday, and the least (11.4%) on Wednesday.
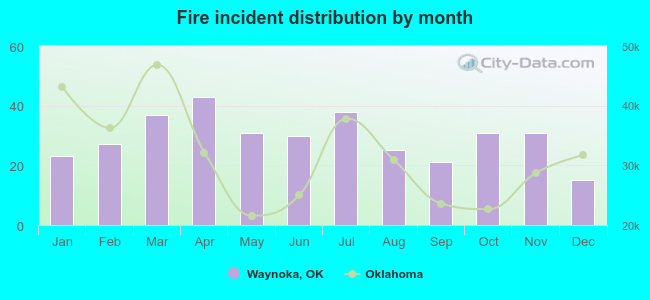 According to the 352 fires from years 2002 - 2018 most fires (12.2%) took place during April, and the least (4.3%) in December.
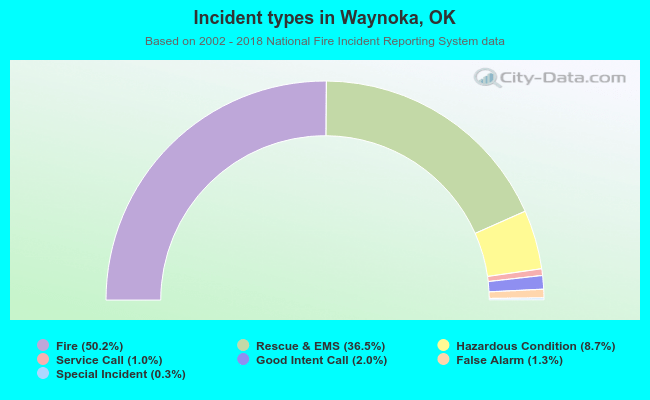 Out of all 701 cases reported during the years 2002 - 2018, the most belonged to the categories: Fire (50.2%), Overpressure Rupture (36.5%), and Rescue & EMS (8.7%).
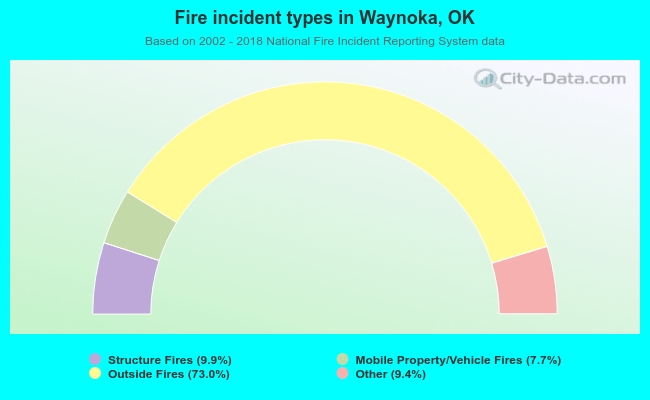 When looking into fire subcategories, the most incidents belonged to: Outside Fires (73.0%), and Structure Fires (9.9%).