| Fire incidents reported |
|---|
| Sreet name | Count |
|---|
| BATTLE ST | 108 | | WHITE PLAINS RD | 28 | | LITTLE HILL RD | 26 | | NEW HAMPSHIRE DR | 24 | | TYLER RD | 20 | | DEER MEADOW RD | 18 | | LITTLE HILL ROAD | 14 | | BATTLE STREET | 10 | | CONCORD DR | 10 | | GERRISH RD | 10 | | MUTTON RD | 10 | | PLEASANT ST | 10 | | CORN HILL RD | 8 | | LITTLE HILL RD | 8 | | LONG ST | 8 | | BRIDGE HOUSE RD | 6 | | CLOUGH SANBORN HILL RD | 6 | | DUSTIN RD | 6 | | POTASH RD | 6 | | ROBY RD | 6 | | WALKER POND RD | 6 | | BATTLE ST. | 4 | | BEAVER DAM RD | 4 | | BLACKBERRY LN | 4 | | CHADWICK HILL RD | 4 |
| | | Fire incidents reported |
|---|
| Sreet name | Count |
|---|
| DEER MEADOW | 4 | | MOUNT VERNON TER | 4 | | MOUNT VERNON TERRACE | 4 | | PEARSON HILL RD | 4 | | WINNEPOCKET RD | 4 | | 389 LITTLE HILL RD | 2 | | 401 LITTLE HILL RD | 2 | | BEAVER DAM DR | 2 | | BRIDGE HOUSE | 2 | | BRIDGE HOUSE ROAD RD | 2 | | BROAD COVE RD | 2 | | BROOKSIDE | 2 | | CALL RD | 2 | | CLOTHESPIN BRIDGE RD | 2 | | COUCHTOWN RD | 2 | | DEER MEADWOW RD | 2 | | FREEMAN COLBY RD | 2 | | GARISH RD | 2 | | GARRISH RD | 2 | | GERISH/HOLLOW RD | 2 | | GERRISH ROAD | 2 | | GUIDE BOARD HILL RD | 2 | | HIGH ST | 2 | | HOLLINGS DR | 2 | | |
|
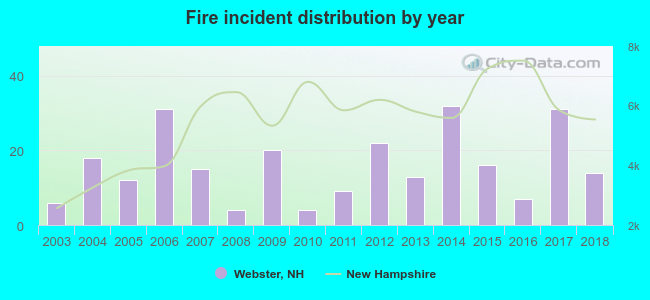 According to the data from the years 2003 - 2018 the average number of fire incidents per year is 16. The highest number of reported fires - 32 took place in 2014, and the least - 4 in 2008. The data has a rising trend.
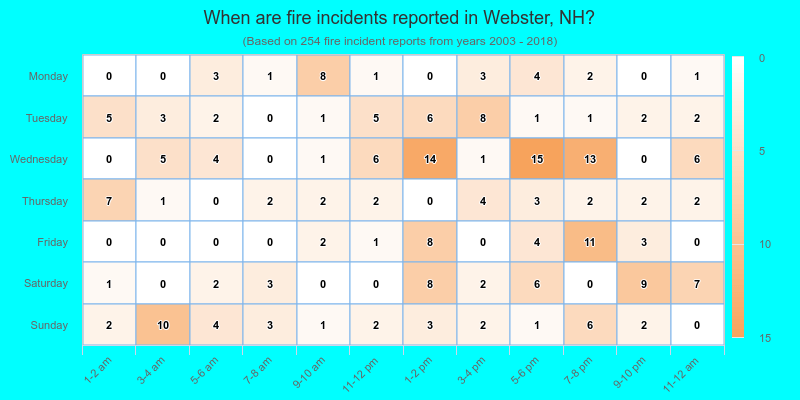
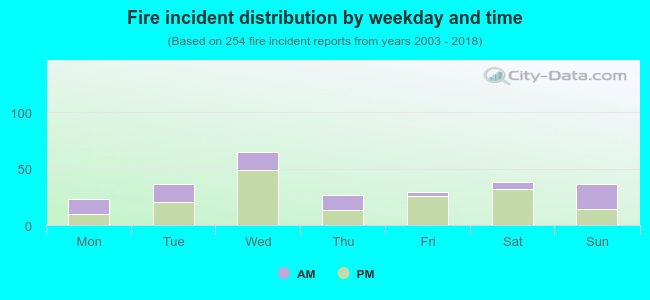 35.4% incidents where reported in the morning and 64.6% in the evening. The most fires (25.6%) took place on Wednesday, and the least (9.1%) on Monday.
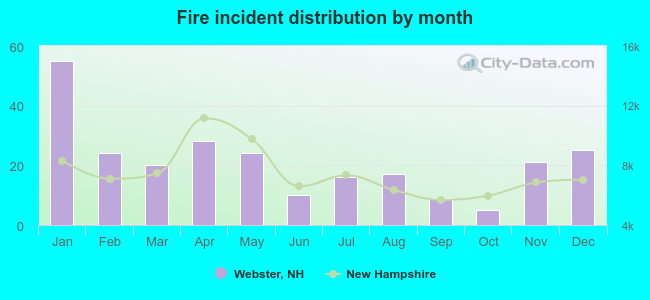 Based on the 254 fire incidents from years 2003 - 2018 most fires (21.7%) took place during January, and the least (2.0%) in October.
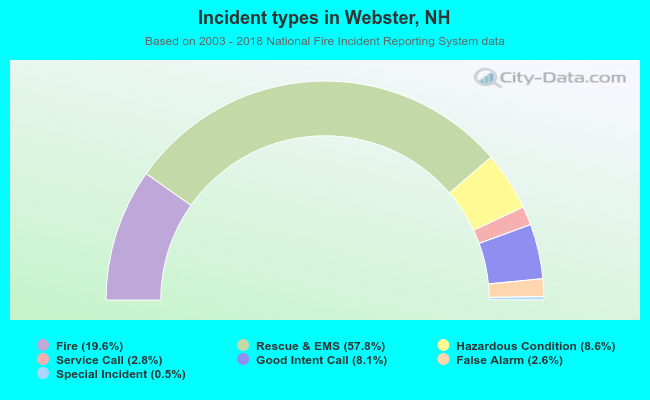 Out of all 1,297 cases reported during the years 2003 - 2018, the most belonged to the categories: Overpressure Rupture (57.8%), Fire (19.6%), and Rescue & EMS (8.6%).
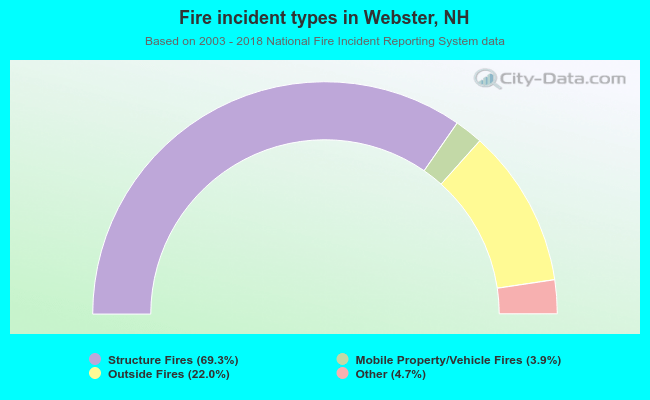 When looking into fire subcategories, the most incidents belonged to: Structure Fires (69.3%), and Outside Fires (22.0%).