Wesley Hills: Fire Incidents, New York (NY)
Where are fire incidents reported in Wesley Hills, NY
Something went wrong! Please refresh the page.
|
| |||||||||||||||||||||||||||||||||||||||||||||||||||||||||||||||||||||||||||||||||||||||||||||||||||||||||||||
2003 - 2018 National Fire Incident Reporting System (NFIRS) incidents
- Incident types reported to NFIRS in Wesley Hills, NY
- 31130.6%Hazardous Condition
- 25725.3%Fire
- 19118.8%False Alarm
- 17016.7%Good Intent Call
- 504.9%Rescue & EMS
- 353.4%Service Call
- Fire incident types reported to NFIRS in Wesley Hills, NY
- 16765.0%Structure Fires
- 6324.5%Outside Fires
- 155.8%Other
- 124.7%Mobile Property/Vehicle Fires
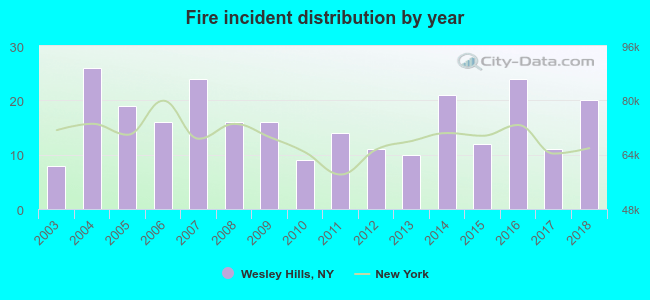 Based on the data from the years 2003 - 2018 the average number of fire incidents per year is 16. The highest number of reported fire incidents - 26 took place in 2004, and the least - 8 in 2003. The data has a rising trend.
The average number of yearly fire incidents per 10k residents in Wesley Hills, NY compared to nearest cities:
(Note: Based on data for the last 3 years, including only cities with population 5,000 and above)
| Wesley Hills: | 31.0 |
| New Hempstead: | 30.8 |
| Viola: | 23.8 |
| Kaser: | 16.0 |
| Monsey: | 31.5 |
| New Square: | 16.5 |
| Hillcrest: | 7.5 |
| Spring Valley: | 13.7 |
| Mount Ivy: | 1.5 |

 37.0% incidents where reported in the morning and 63.0% in the evening. The most fires (24.1%) took place on Friday, and the least (7.0%) on Saturday.
 According to the 257 reports from years 2003 - 2018 most fires (15.6%) took place during April, and the least (3.5%) in November.
 Out of all 1,016 cases reported during the years 2003 - 2018, the most belonged to the categories: Hazardous Condition (30.6%), Fire (25.3%), and False Alarm (18.8%).
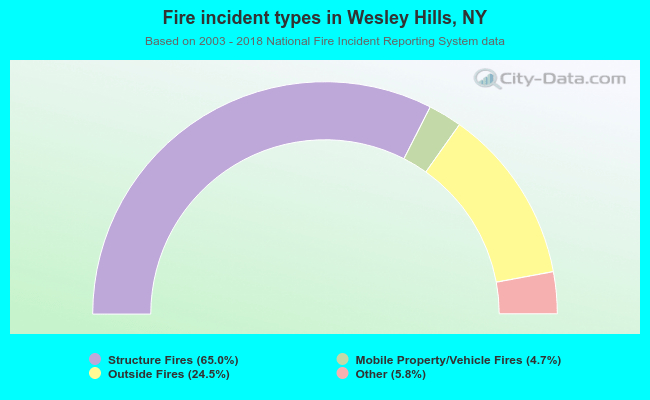 When looking into fire subcategories, the most incidents belonged to: Structure Fires (65.0%), and Outside Fires (24.5%).